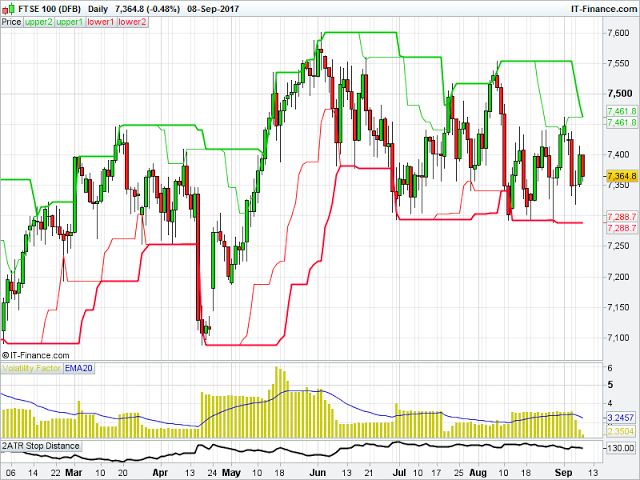
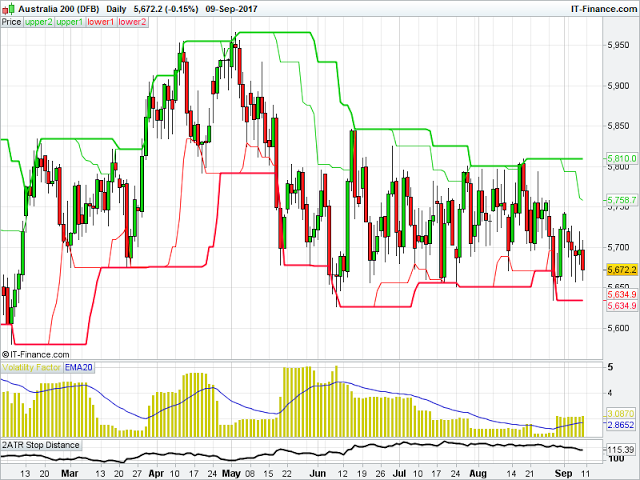
If you are inclined to trade the indices, you may be familiar with the charts of the UK FTSE and the Australian ASX , which show a distinct lack of direction in recent months:

What a mess these two charts are.
You can see that when price has attempted to breakout, it has quickly reversed. If you are not careful, it is these types of chart that entice you into repeated trades, leading to whipsaws and an erosion of your equity.
When I am evaluating a setup, I am also interested in how price has acted in prior to a potential breakout.
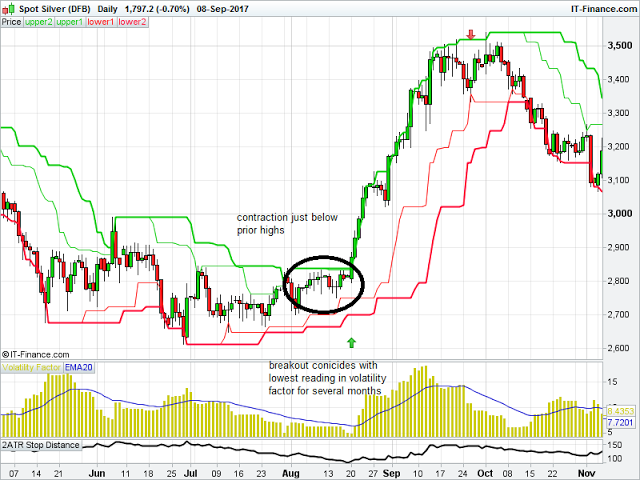
Ideally, what I am looking for is a contraction in volatility and a price consolidation near the breakout level.
No less a figure than Jerry Parker talked about this type of set up here.
On these two charts, you can see many failed breakout attempts. However, if you look closer, you will see that the vast majority of attempts to breakout to the upside have followed 2 or 3 days where price moved up strongly, or an attempt to breakout to the downside were preceded by 2 or 3 days where price moved down strongly. Price has often oscillated from being close to new lows to being close to new highs, or vice versa, in a short period of time.
In these cases, there is no such contraction in volatility or a 'coiling of a spring' in terms of price movement. This would mean that those setups would not be of interest to me.
Given the inherent level of volatility in the indices, it is extremely rare for me to find a decent set up to trade these.
A good example of what I look is shown in this chart of silver. You will see how price has consolidated just below new highs, and there is a decent contraction both in the volatility factor indicator I use, plus the 2ATR reading. This acts as a build up of energy waiting to be released, leading into a text book breakout:

Here is also an example on the short side using the EUR/USD from a couple of years ago.
Of course, even if you spot this contraction just below a long breakout level or just above a short breakout level, this does not mean that, if a breakout occurs, the trade will be successful. Even the best setups fail. But this is something I have found very useful in my own trading and it might help you too.
