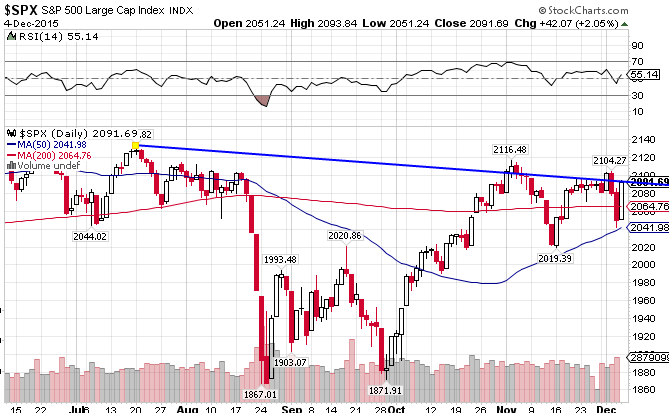
Within the last two months, the S&P 500 Index (iShares Core S&P 500 (N:IVV)) has rebounded remarkably from the lows made in late August, breaking above both moving averages and getting close to new all-time highs. And after a whirlwind week, in which the market both fell and rose vehemently because interest rates are due to rise (wtf!?, can’t you make up your mind?), the index once again tested and held the 50-day MA and ended up right where it was before. The S&P 500 is up 3.54% year-to-date.
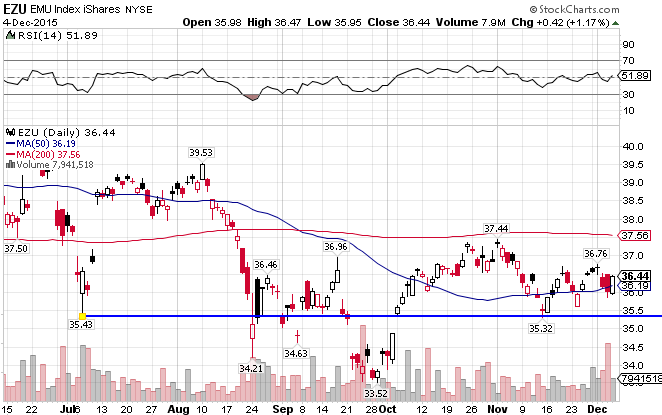
The EMU Index (N:EZU), for the European Economic and Monetary Union, fell more gradually over a longer period of time when compared with its US counterpart. And it never recovered with the same verocity. Europe has been consistently underperforming the US for some time now, after outperforming for half of the year. The index is up 2.06% for all of 2015.
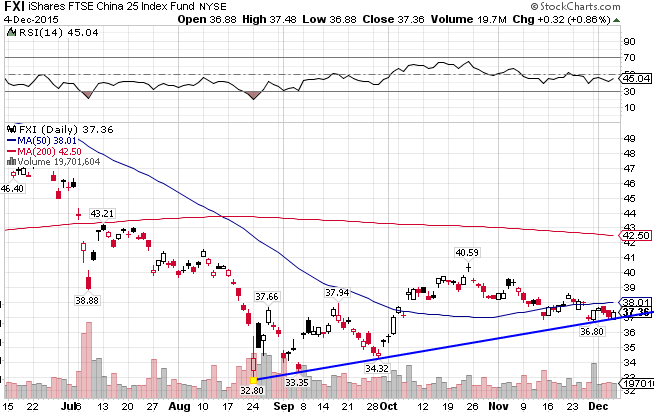
After a huge “irrationally exuberant” run into April, the Chinese markets (iShares China Large-Cap ETF (N:FXI)) plunged over 35%, breaking both long-term MAs. It has been trading within a range since but may break out soon, as it looks to have formed a reverse head and shoulders stock formation. It must hold support at the 36 level though. The China Large Cap index is now down 9.77% in 2015.
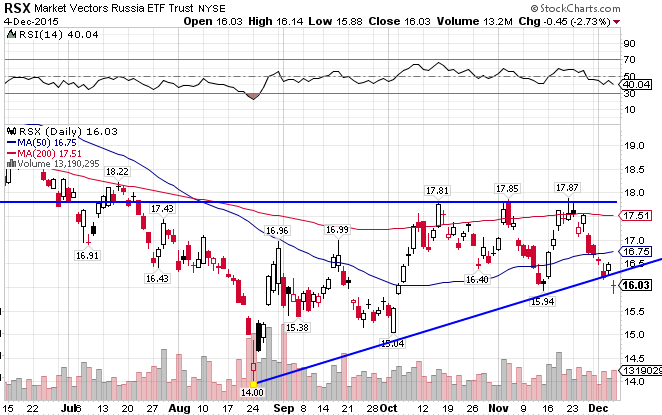
The Russian Index (Market Vectors Russia (N:RSX)) has been hit pretty hard by the collapse in the price of crude oil and by the US-EU-imposed sanctions. It has been mired in an ugly downtrend line until recently though, but must get above the 38 level or risk failing at resistance again. RSX is now up only 9.57% in 2015 after a spectacular first half of the year.
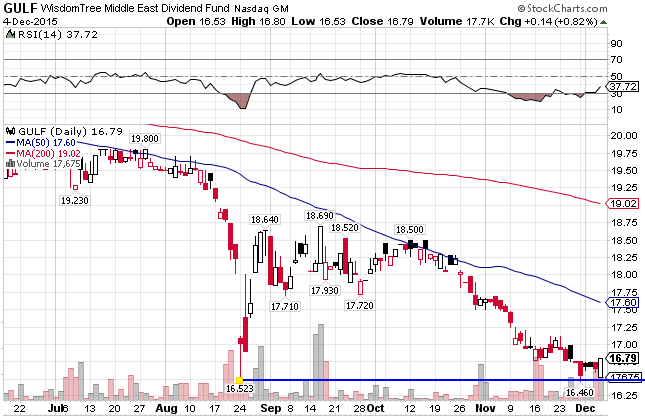
A stronger US dollar, ISIS, and crashing crude oil prices are just a few of the things the Middle East Index (WisdomTree Middle East Dividend (O:GULF)) has to contend with. The index may be looking at new lows in the near future. The supply of crude oil is probably the biggest driving factor of this market, and that is still a net negative for the index, especially with Iran coming to the market soon. The index is down 14.67% since the beginning of the year.
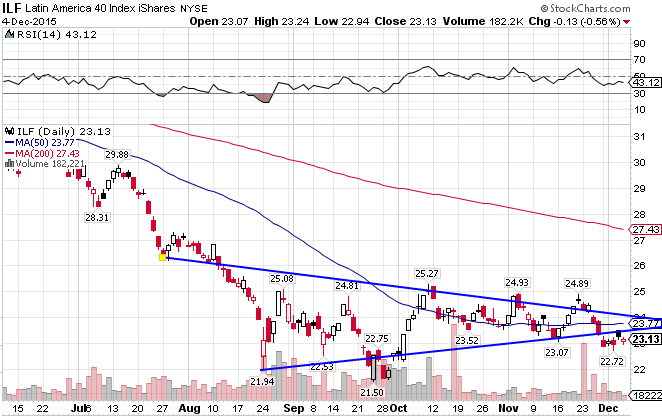
Another region hit hard by the commodity bust, the Latin American market (iShares Latin America 40 (N:ILF)) broke down in May and again in August after an impressive recovery from its March lows. It now finds itself just below support at the 50-day MA. It has moved concurrently with the crashing commodities market and is still struggling to hold any support. The index has recorded a loss of 26.23% this year.
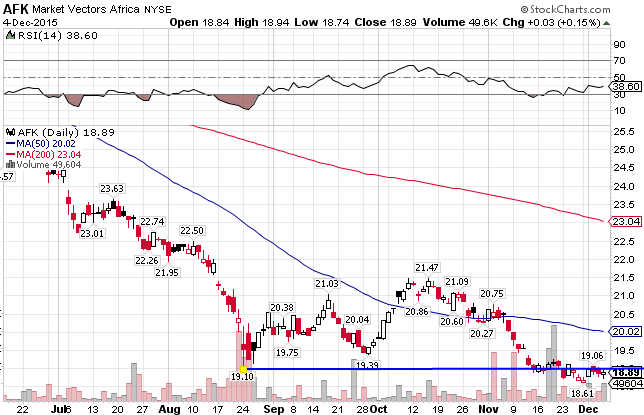
Africa’s market (Market Vectors Africa (N:AFK)) has managed to grind higher for most of 2014. But continued upheaval in Northern Africa, coupled with a weak global economy, has finally dampened Africa’s run. It is down 26.51% for 2015 after a tough summer and a horrendous November.
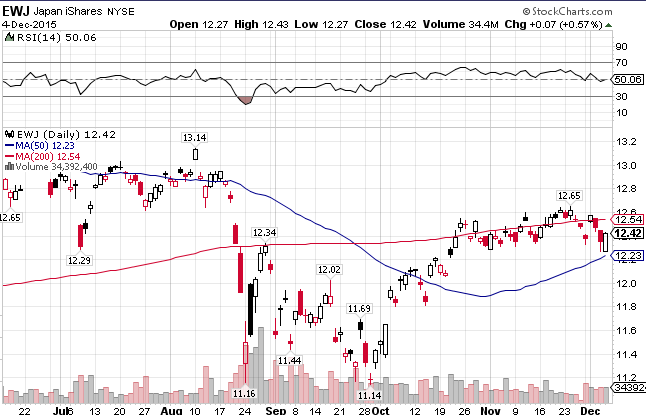
Japan (iShares MSCI Japan (N:EWJ)) is holding onto gains that were made after the BOJ unexpectedly eased monetary policy in the beginning of the year. Japan is up 11.06% YTD, the best performing market.
