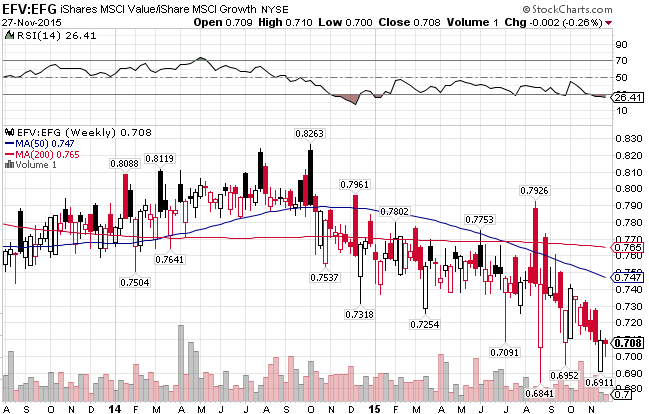
The wedge pattern that was formed by the S&P 500 Index ((N:IVV)) finally resolved itself with a big move downward in August. The market corrected to the 1867 and retested that low in late September. Since the beginning of October, the market bounced off that level and has been on a tear, surging all the way up to the 2116 level. In order for the index to continue its run, it must get above the 2100 level and test resistance at the all-time high (2133). The index is up 3.49% YTD.
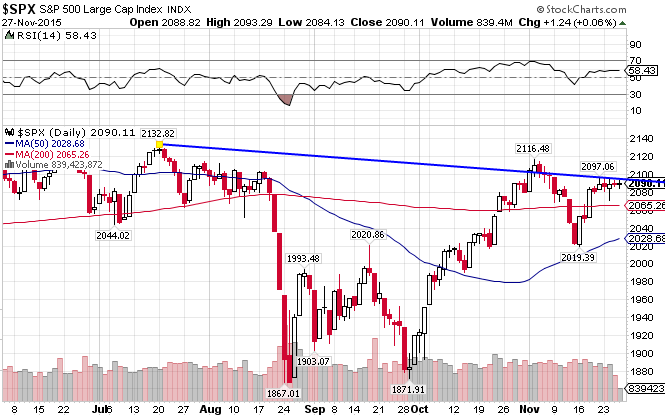
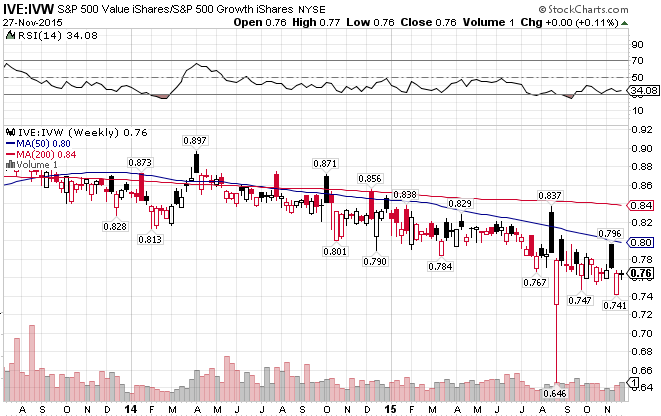
The S&P 500 Value Index ((N:IVE)), which consists primarily of US large-cap value stocks in the financial services, industrial, and consumer cyclical industries, tend to have lower price to earnings ratios and higher dividend yields than the market as a whole. The value index has been out of form this year, having underperformed vs the S&P 500 by a pretty significant margin. The index is down 1.31% for the year.
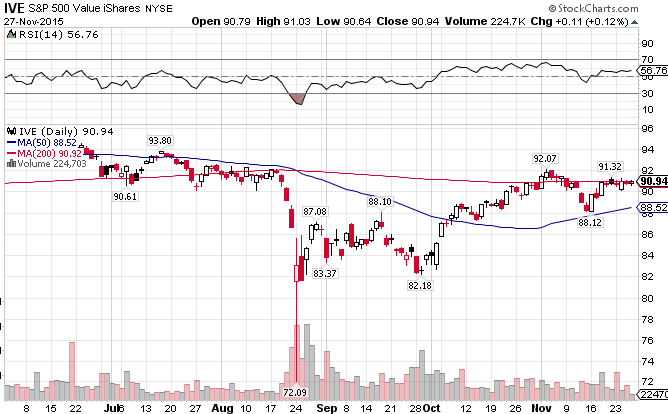
The S&P 500 Growth Index ((N:IVW)), which consists primarily of US large-cap growth stocks in the tech, healthcare, and energy industries, tend to have higher earnings growth rates, higher earnings multiples, and little or no dividend yields. Conversely, growth stocks have been the better bet so far in 2015, as the index is ahead of pace set by the S&P 500, returning 7.71% YTD.
A short-term trend of growth stocks solidly outperforming value stocks has emerged. Over the longer term, you can see the shift from value stocks to growth stocks occurring in mid-2013.
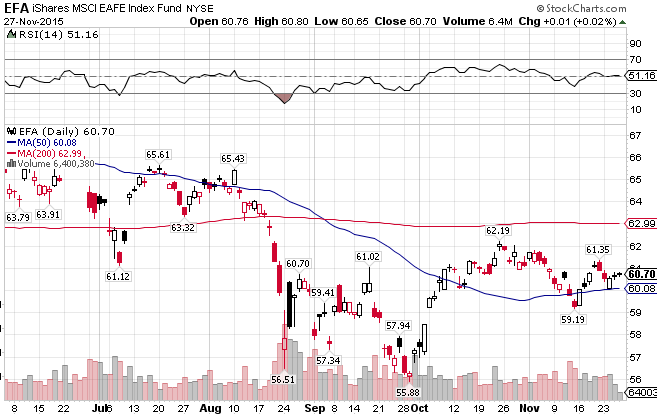
The MSCI EAFE Index ((N:EFA)), a global developed market index that encompasses Europe, Australasia, and the Far East, had significantly underperformed versus the S&P 500 in 2014, and now for 2015 as well, after a terrible last few months for global stocks. The EAFE Index was outperforming the US markets by a significant margin earlier this year, but that has flipped, as it is returning only 1.46% YTD. The index is having trouble getting over the 200-day MA.
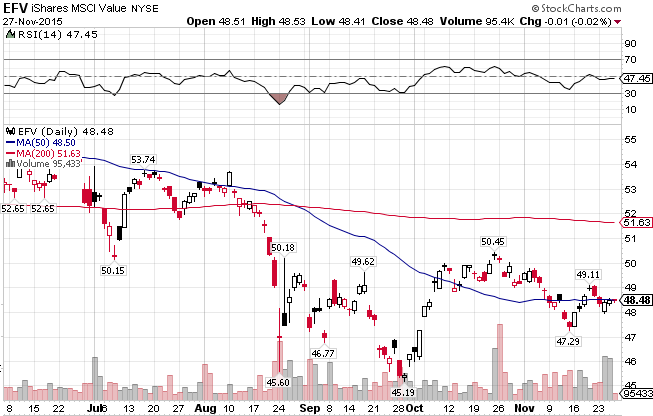
The MSCI EAFE Value Index ((N:EFV)) consists primarily of low P/E international large-cap value stocks in the financials, energy, and communications industries. Like the US markets, international value stocks are also underperforming growth stocks of late, returning -2.92% YTD.
The MSCI EAFE Growth Index ((N:EFG)), which consists primarily of high-growth international large-cap growth stocks in the industrial, healthcare, and consumer cyclical industries, has outperformed compared to the value index, and the spread is widening. The index is up 5.41% YTD.
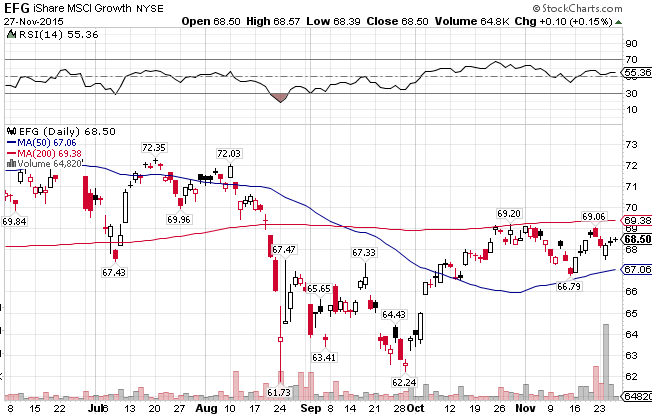
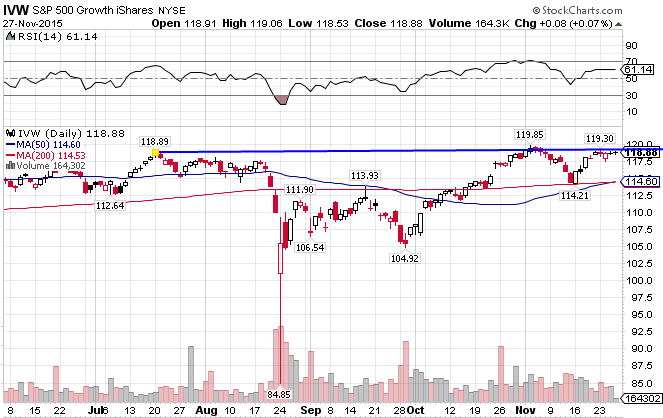
Over the long term, a shift from value stocks to growth occurred in late 2014.
