👀 Ones to watch: The MOST undervalued stocks to buy right nowSee Undervalued Stocks

A Closer Look: Market Cap

Published 02/22/2016, 03:14 AM
Updated 05/14/2017, 06:45 AM
US500
-
US2000
-
EFA
-
IVV
-
IWM
-
RSP
-
SCZ
-

This past week, the S&P 500 Cap-Weighted Index ((N:IVV)) tested and then broke strong support at the 50 and 200-day moving averages after a remarkable rebound from its crushing meltdown in August of last year. Look for a possible bounce here, so long as it can get above resistance at the 1950 level, as the market is slightly oversold. The S&P 500 is down 5.83% for the year.
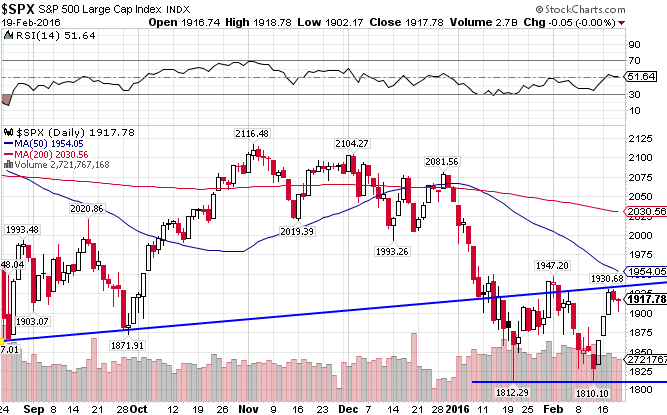
SPX Daily Chart

The S&P 500 Equal-Weighted index ((N:RSP)) is set up so that every stock in the index has the same weight, thereby eliminating the market-weighting growth bias. As a result, the index tilts more towards mid-cap and value stocks, which accounts for much of the out-performance versus the cap-weighted index in the last decade. So far this year, the index is down 6.18% year-to-date, slightly underperforming the cap-weighted index.
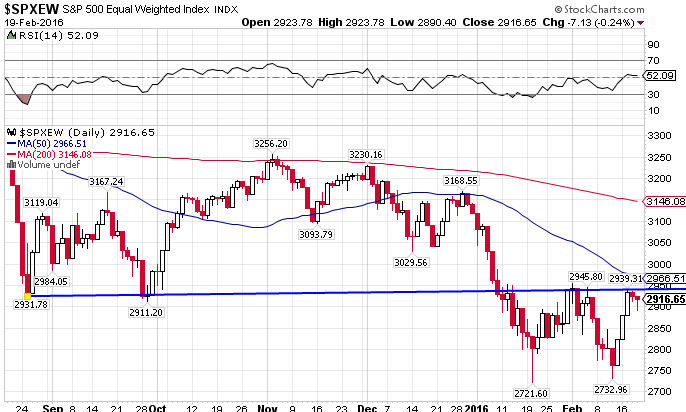
SPXEW Daily Chart

One of the themes of the past decade has been growth-oriented, smaller cap stocks outperforming high quality, blue chip stocks. That trend is no longer intact for 2015 and into 2016, as the bottom fell out from under the Russell 2000 index ((N:IWM)) in the 4th quarter of 2015 and into 2016. IWM is underperforming the large cap index and is down 10.81% YTD.
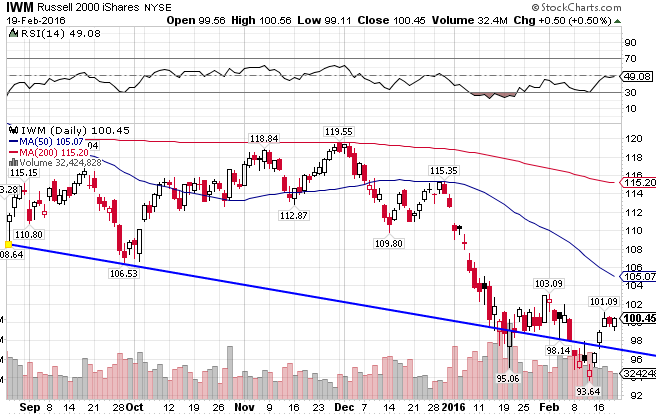
IWM Daily Chart

The S&P 500 versus the Russell 2000 Index, Weekly Chart. It seems that the large cap index has broken out in the past couple of months. A big move was expected, and that is now coming to fruition.
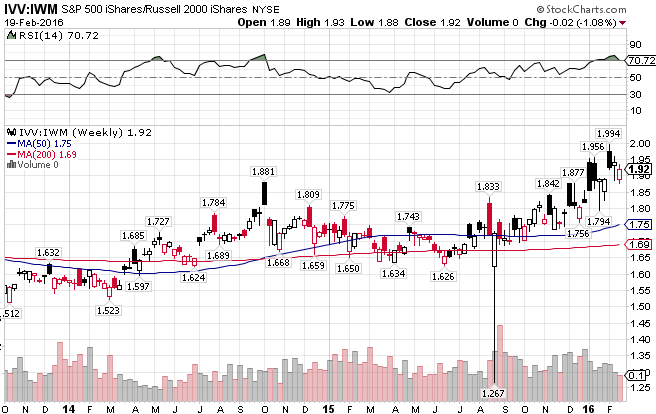
IVV/IWM Weekly Chart

Looks like the weakening Chinese economy managed to deflate the MSCI EAFE Index ((N:EFA)). The index is down 8.17% since the beginning of the year, slightly worse than its US counterpart, continuing the trend that began in the second half of last year.
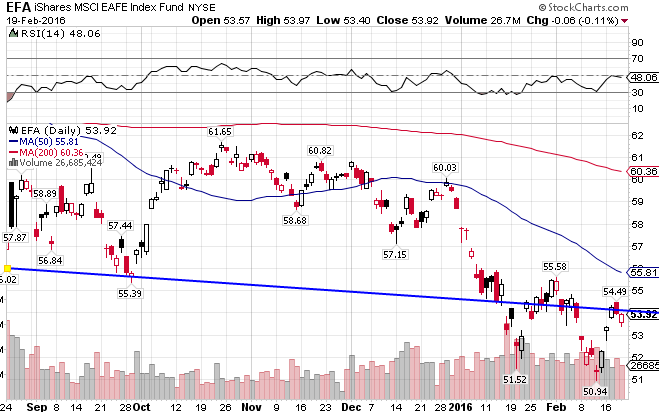
EFA Daily Chart

The MSCI EAFE Small Cap ((N:SCZ)) has performed slightly better than the large cap index this year (-7.95%), after impressively holding onto a 9% gain last year. Unlike the US markets, international small caps are outperforming their large cap index over the last 12 months.
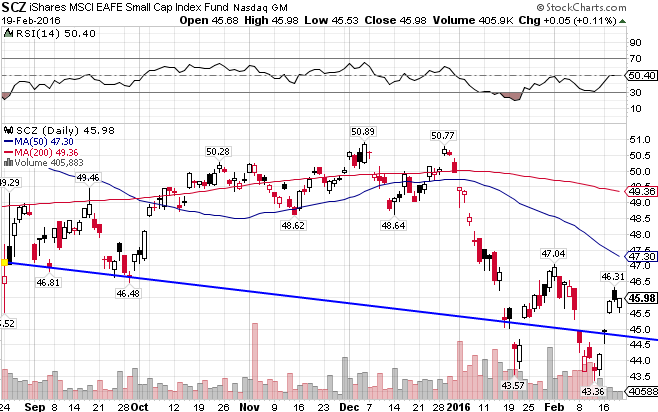
SCZ Daily Chart

EAFE Large Cap Index vs EAFE Small Cap Index, Weekly View. It’s been a steady small cap outperformance since October of last year.
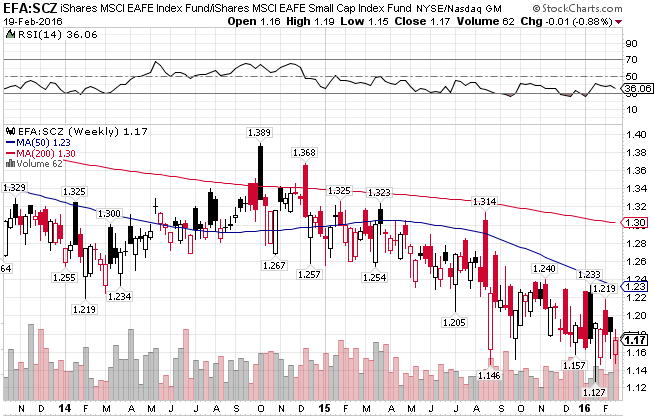

EFA/SCZ Weekly Chart

Latest comments

Loading next article…
Risk Disclosure: Trading in financial instruments and/or cryptocurrencies involves high risks including the risk of losing some, or all, of your investment amount, and may not be suitable for all investors. Prices of cryptocurrencies are extremely volatile and may be affected by external factors such as financial, regulatory or political events. Trading on margin increases the financial risks.
Before deciding to trade in financial instrument or cryptocurrencies you should be fully informed of the risks and costs associated with trading the financial markets, carefully consider your investment objectives, level of experience, and risk appetite, and seek professional advice where needed.
Fusion Media would like to remind you that the data contained in this website is not necessarily real-time nor accurate. The data and prices on the website are not necessarily provided by any market or exchange, but may be provided by market makers, and so prices may not be accurate and may differ from the actual price at any given market, meaning prices are indicative and not appropriate for trading purposes. Fusion Media and any provider of the data contained in this website will not accept liability for any loss or damage as a result of your trading, or your reliance on the information contained within this website.
It is prohibited to use, store, reproduce, display, modify, transmit or distribute the data contained in this website without the explicit prior written permission of Fusion Media and/or the data provider. All intellectual property rights are reserved by the providers and/or the exchange providing the data contained in this website.
Fusion Media may be compensated by the advertisers that appear on the website, based on your interaction with the advertisements or advertisers.
© 2007-2024 - Fusion Media Limited. All Rights Reserved.