A CBI Of 9 And S&P 500 At A 20-Day Low

Published 03/26/2018, 08:33 AM
US500
-

Over the weekend, I decided to run some new studies based on the Quantifiable Edges Capitulative Breadth Indicator (CBI). As I tweeted out near the close, the CBI reached 9 on Friday. Historically, I have viewed 10+ as the level that really gets me excited about a potential bounce. I decided to examine market performance other times the S&P 500 closed at a 20-day low and the CBI reached a level of X of higher. In the study below I hold the market position until the CBI returns to 3 or lower.

SPX Closes At 20 Day Low CBI

As you can see, results when it hits anywhere 7 or higher are fairly reliable. I have highlighted 9 above since that is the current setup. I also generated a profit curve using 9+ as the entry trigger.
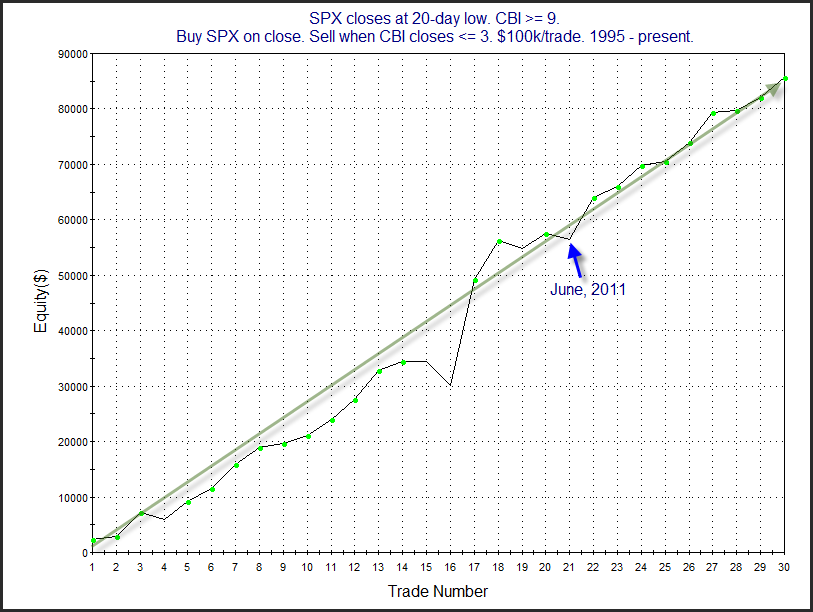
SPX Closes At 20 Day Low CBI

The curve certainly seems to support the idea of a bullish edge. I noted the last loser on the chart, which occurred in June of 2011. While historical odds would look a bit better with a slightly higher CBI, the current reading of 9 has been enough that a bounce was often seen. We may already be seeing that bounce begin this morning. For those that would like to learn more about the CBI, I recently wrote a detailed research paper about it. Additionally, there are a large number of studies about the CBI that can be found on the blog.

Latest comments

Loading next article…
Risk Disclosure: Trading in financial instruments and/or cryptocurrencies involves high risks including the risk of losing some, or all, of your investment amount, and may not be suitable for all investors. Prices of cryptocurrencies are extremely volatile and may be affected by external factors such as financial, regulatory or political events. Trading on margin increases the financial risks.
Before deciding to trade in financial instrument or cryptocurrencies you should be fully informed of the risks and costs associated with trading the financial markets, carefully consider your investment objectives, level of experience, and risk appetite, and seek professional advice where needed.
Fusion Media would like to remind you that the data contained in this website is not necessarily real-time nor accurate. The data and prices on the website are not necessarily provided by any market or exchange, but may be provided by market makers, and so prices may not be accurate and may differ from the actual price at any given market, meaning prices are indicative and not appropriate for trading purposes. Fusion Media and any provider of the data contained in this website will not accept liability for any loss or damage as a result of your trading, or your reliance on the information contained within this website.
It is prohibited to use, store, reproduce, display, modify, transmit or distribute the data contained in this website without the explicit prior written permission of Fusion Media and/or the data provider. All intellectual property rights are reserved by the providers and/or the exchange providing the data contained in this website.
Fusion Media may be compensated by the advertisers that appear on the website, based on your interaction with the advertisements or advertisers.
© 2007-2025 - Fusion Media Limited. All Rights Reserved.