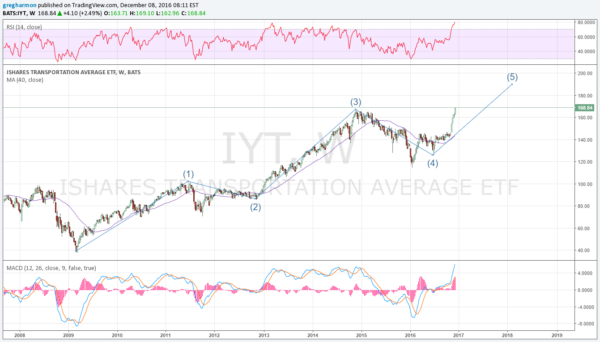
The Dow Transport Index made headlines yesterday. It made its first new high since a peak in late 2014. Throughout 2015 it had moved lower and despite the early progress in 2016, it had stalled by March, far from a retracement to the highs. Only over the last 4 weeks has it started to move out of a malaise and marched to a new all-time high.
This confirmed one of the oldest technical analysis signals of a bull market. When the Transports make a new high along with the more famous Dow Jones Industrial Average, they confirm a continuation or resumption of the primary trend to the upside, a bull market. But that does not mean that all is puppy dogs and sunshine for the Transports going forward.

The chart above can help explain why. The 5 wave pattern in play does suggest a move to about 190 on the Transportation Index ETF (NYSE:IYT), that is the good news. But markets do not always move in straight lines. In fact they rarely do. And that is the problem. The Transports have been moving in a straight line higher for the last 4 weeks with strong momentum. As a result of that process there are 3 indications in the chart that suggest a cautious view for the short run.
The first is the distance that the ETF has put between its price and its 40 week (200 day) moving average. You can see on the chart that price does not tend to stay this far from the 40 week SMA for very long. Market technicians call this extended. The second is the Momentum indicators are both running very hot. The RSI at the top of the page near 80 is at extreme levels and signalling an overbought market. The MACD at the bottom is also at extremes where price has reversed before.
These overheated conditions can of course persist. The MACD from 2013 to 2015 is a good example. But they can also be signals of a correction to come. A correction can be through price, with a move back lower towards that 40 week SMA, or through time, with a sideways motion as momentum fades and the 40 week SMA catches up. I certainly do not know which it will be or if the top is even in for the short run. Nobody does. All I know is that the future looks bright for the Transports heading into 2017 but it looks to be a bumpy ride.
DISCLAIMER: The information in this blog post represents my own opinions and does not contain a recommendation for any particular security or investment. I or my affiliates may hold positions or other interests in securities mentioned in the Blog, please see my Disclaimer page for my full disclaimer.
