A Brief History Of The Stock-To-Bond Ratio

Published 10/27/2017, 08:06 AM
US500
-
SPY
-
TLT
-

Much has been said about the stock-to-bond ratio. It has been recognized as a barometer of risk acceptance. As the pendulum swings from placing money in bonds to putting it to work in stocks the market place as a whole is more accepting of risk taking. That is an overly simplified view, but not too far off. take a look at the chart below of the stock to bond ratio as measured by the S&P 500 ETF SPY and the US Treasury ETF TLT.

The ratio rose from 2003 to a peak in the middle of 2007. As the financial crisis began to take hold it started to fall and then accelerated to a low in the beginning of 2009. Risk taking was high ahead of the crisis and low at the bottom, easy-peasy. As markets started to recover so did the stock to bond ratio and it moved higher off of the 2009 low. The correction (yes, I said correction) in markets in 2011 led to a consolidation in a Diamond shape and it pushed to the upside out of the diamond as markets rallied again.
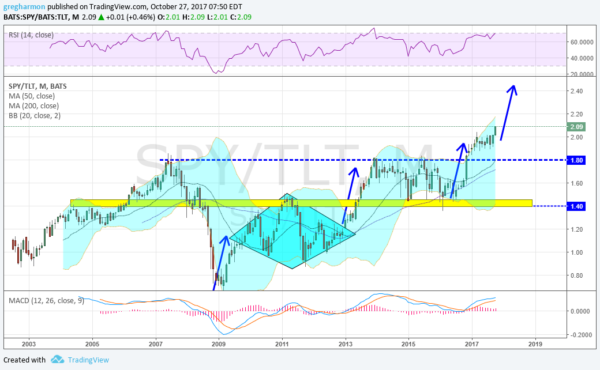
SPY Vs. TLT

As the ratio met its target move it stalled at the end of 2013. The morass that followed, with the ratio stagnating through to the end of 2016 was notable as a period of time when markets took turns, with one sector rallying as others consolidated. In particular the S&P 500 in this case. Its slow growth, coupled with a rebound in Bonds from a premature sell off for expected rising rates, leveled the ratio.

And then the election happened. The ratio took off to the upside in favor of risk taking. It quickly got bogged down as the political landscape showed a strong push forward of the Republican agenda was not a slam dunk. And now it is moving up out of that consolidation. Is it because of the belief that tax reform is coming? Or just very strong growth in corporate earnings? I do not know. But I can see it is happening and I am long stocks.

Latest comments

Loading next article…
Risk Disclosure: Trading in financial instruments and/or cryptocurrencies involves high risks including the risk of losing some, or all, of your investment amount, and may not be suitable for all investors. Prices of cryptocurrencies are extremely volatile and may be affected by external factors such as financial, regulatory or political events. Trading on margin increases the financial risks.
Before deciding to trade in financial instrument or cryptocurrencies you should be fully informed of the risks and costs associated with trading the financial markets, carefully consider your investment objectives, level of experience, and risk appetite, and seek professional advice where needed.
Fusion Media would like to remind you that the data contained in this website is not necessarily real-time nor accurate. The data and prices on the website are not necessarily provided by any market or exchange, but may be provided by market makers, and so prices may not be accurate and may differ from the actual price at any given market, meaning prices are indicative and not appropriate for trading purposes. Fusion Media and any provider of the data contained in this website will not accept liability for any loss or damage as a result of your trading, or your reliance on the information contained within this website.
It is prohibited to use, store, reproduce, display, modify, transmit or distribute the data contained in this website without the explicit prior written permission of Fusion Media and/or the data provider. All intellectual property rights are reserved by the providers and/or the exchange providing the data contained in this website.
Fusion Media may be compensated by the advertisers that appear on the website, based on your interaction with the advertisements or advertisers.
© 2007-2025 - Fusion Media Limited. All Rights Reserved.