Who is Kevin Hassett? Wolfe looks at the Trump ally tipped to become Fed Chair.
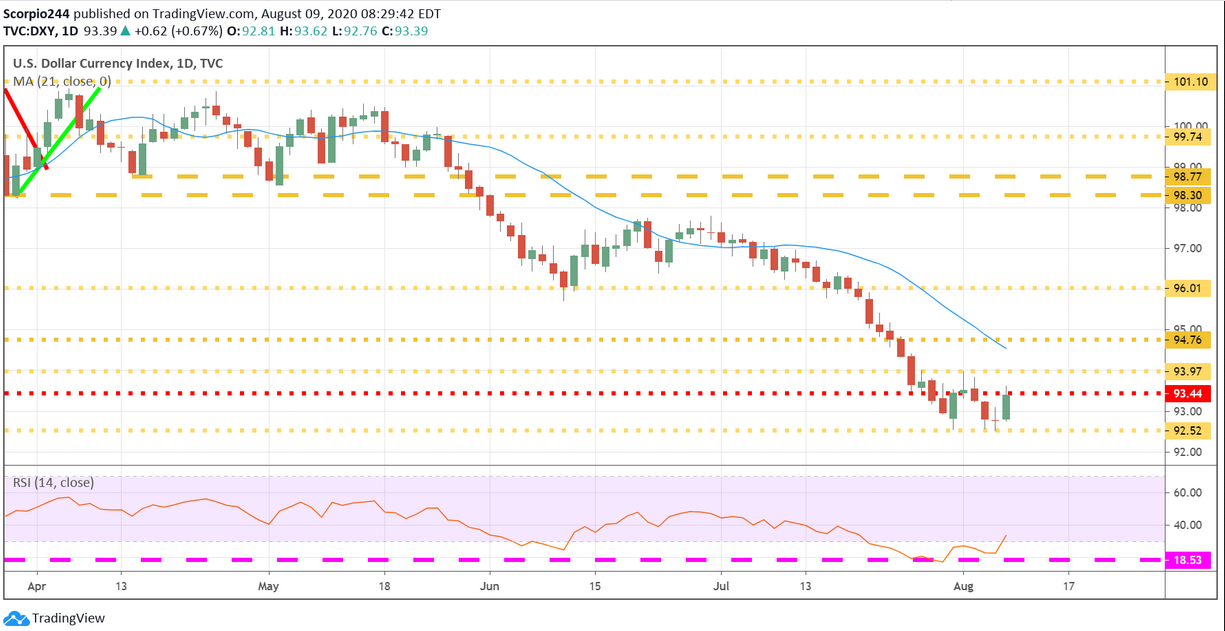
Friday marked what could be the start of a significant shift in the market following the jobs report. The dollar index rallied sharply and appeared to have put in a double bottom. The index has found a significant level of support around 92.50, and should it rally beyond 94; it would likely confirm that double bottom pattern and set up a run to around 96. The RSI also hit very sold levels around 17.50 and is now beginning to show signs of a reversal of the trend.
If this is the case, it could market the unwind of the risk-on trade.
Copper
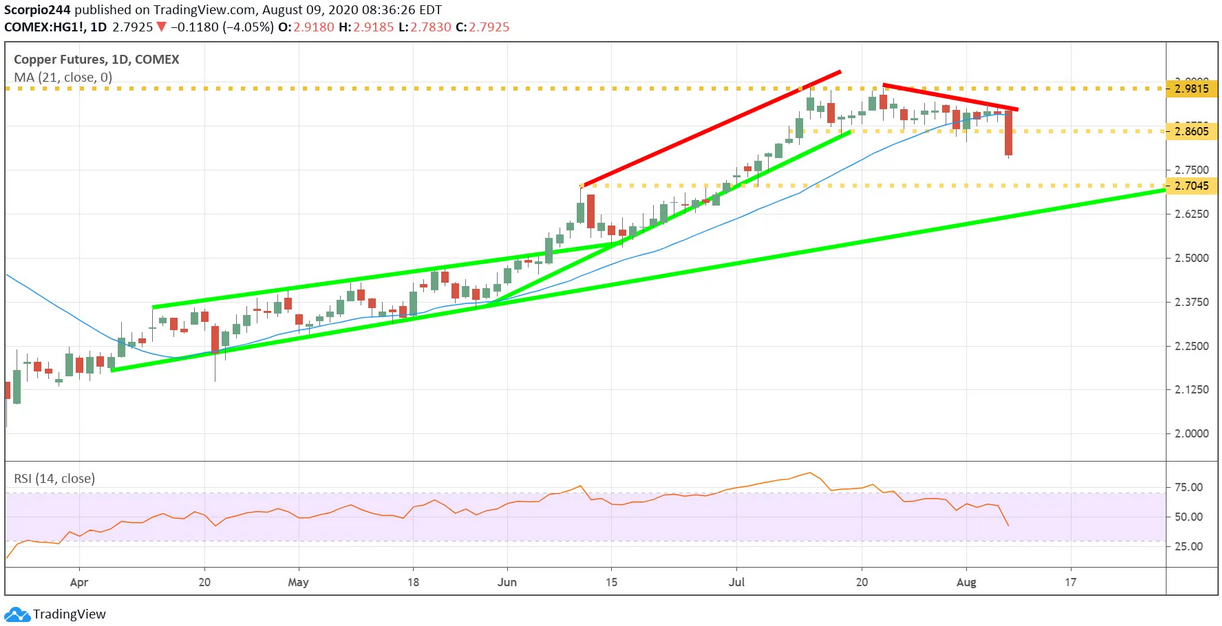
Copper was smashed on Friday, falling by over 4% and breaking some crucial support around the $2.86 level. Additionally, the RSI suggests the metal still has further to fall, perhaps to around $2.70 from its current price of approximately $2.83.
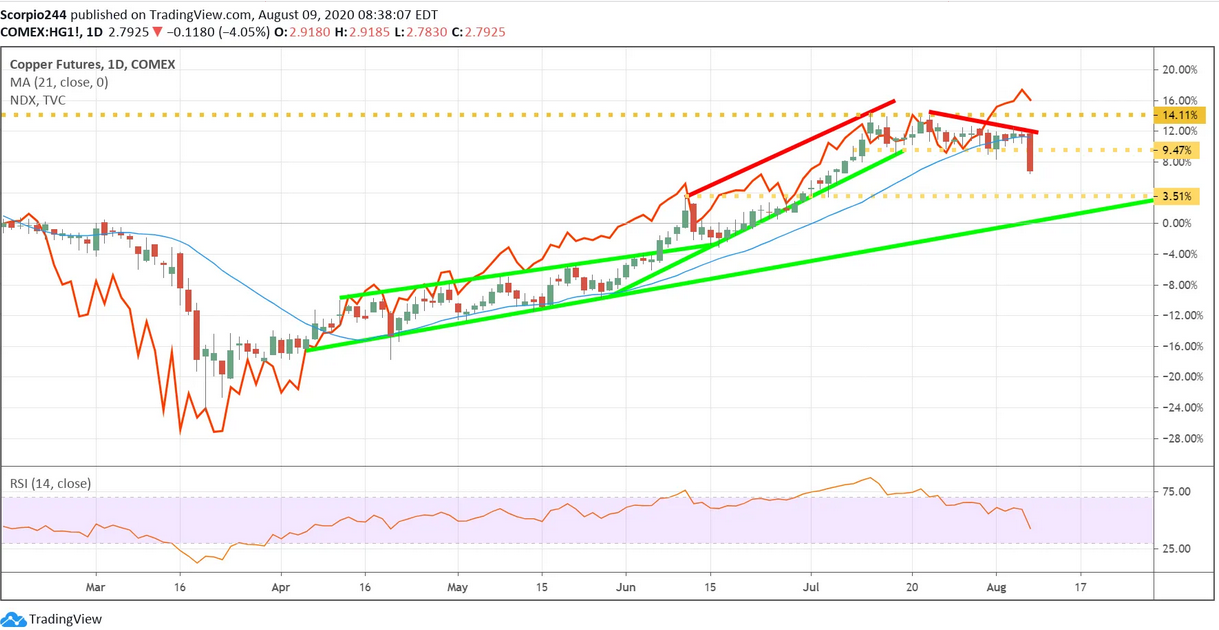
Copper prices and the NASDAQ 100 have been highly correlated since the March lows, and either the two will now diverge, or copper is sending a horrible warnings sign for the NASDAQ 100.
Nasdaq ETF
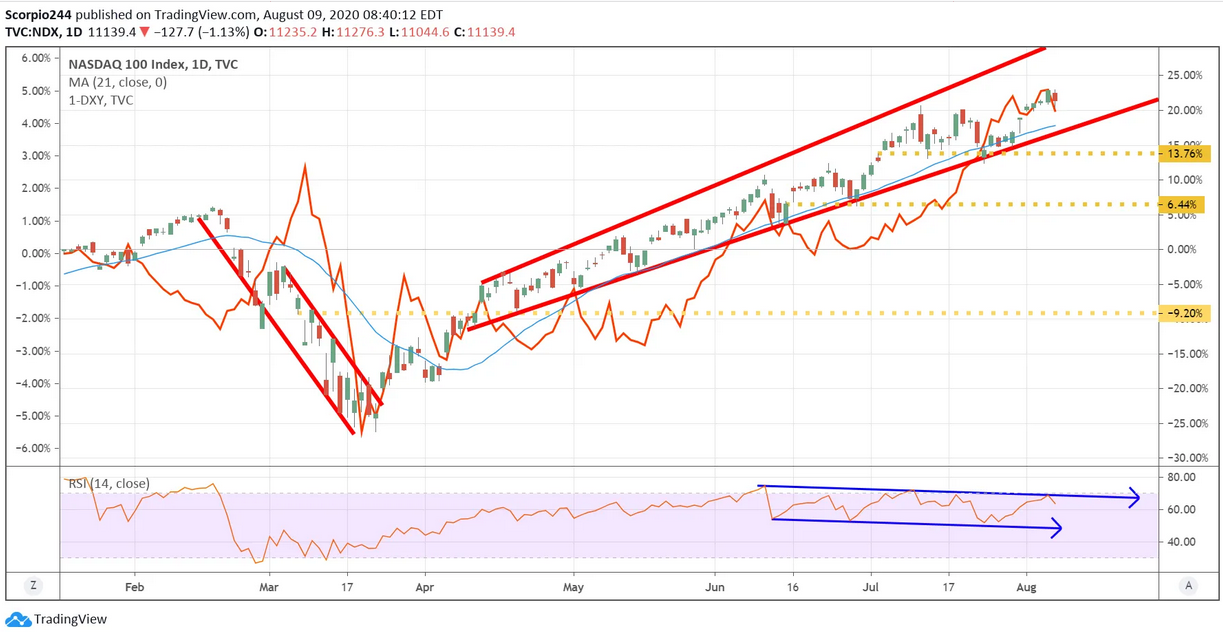
One can also see how closely related the Invesco QQQ Trust (NASDAQ:QQQ) and the dollar index have been over the past few months. Remember, a weak dollar acts as a tailwind to equity prices because it will help to boost revenue and corporate profits of multi-nationals, a strong dollar –well does the opposite.
Gold ETF
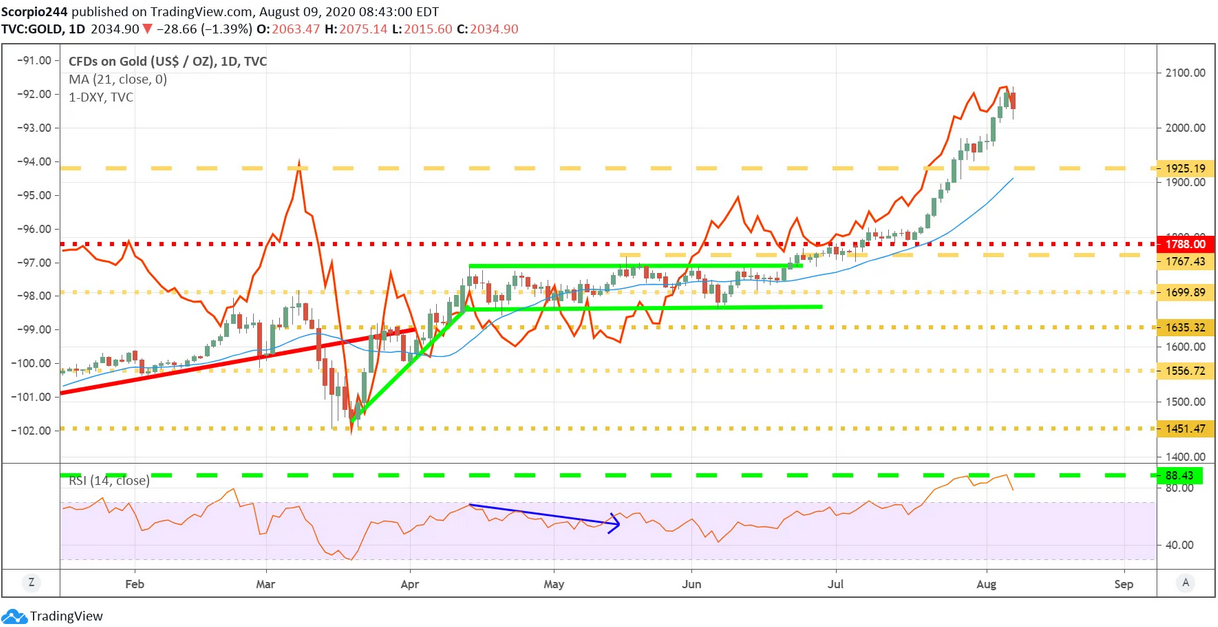
A strong dollar will also be a killer for the SPDR® Gold Shares (NYSE:GLD) and silver trade as well, with the potential for gold to fall back to $1,925.
Silver ETF
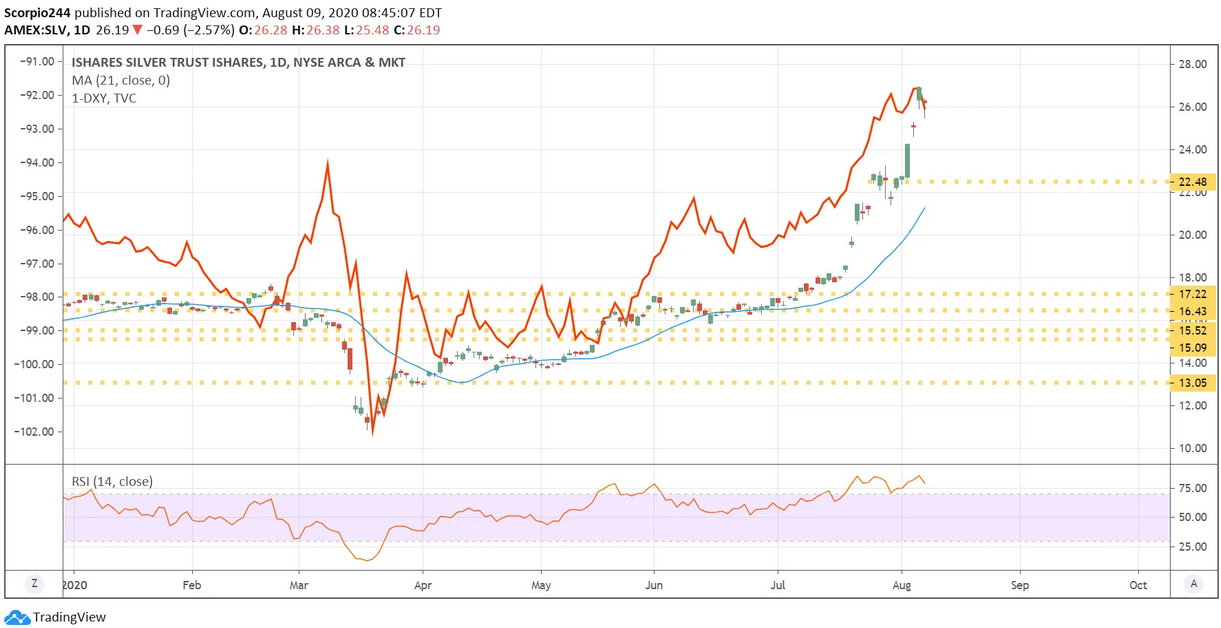
And the potential for iShares Silver Trust (NYSE:SLV) to fall back to $22.50.
S&P 500 ETF
Don’t think it stops there because the SPDR S&P 500 (NYSE:SPY) has also seen a little boost from the short-dollar trade too.
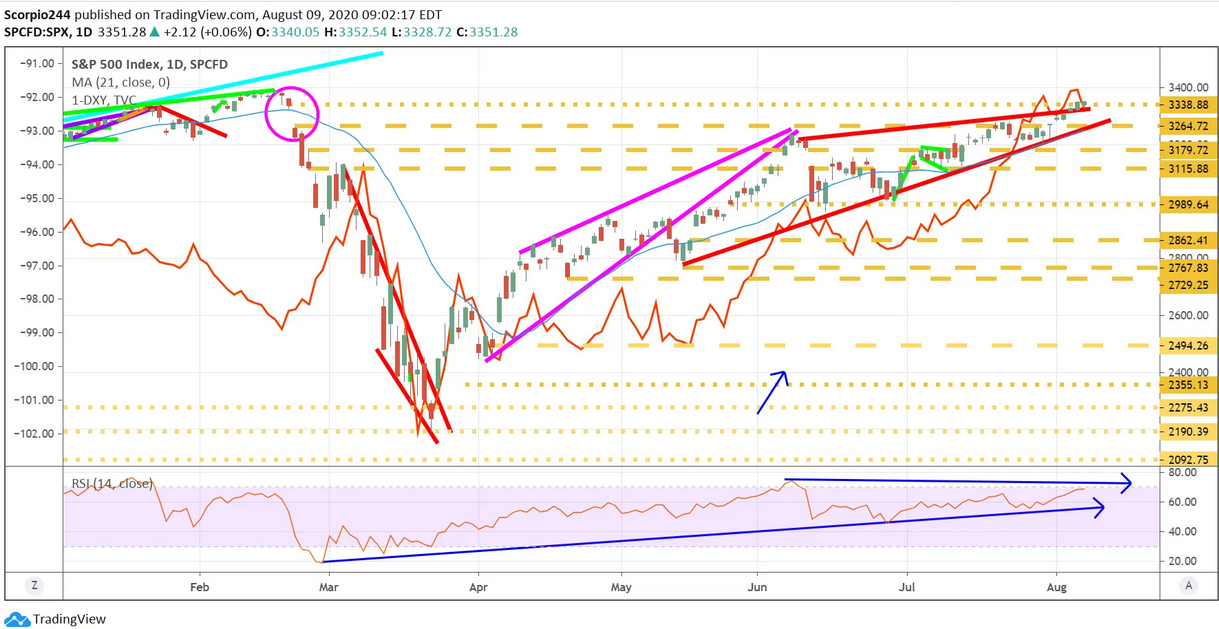
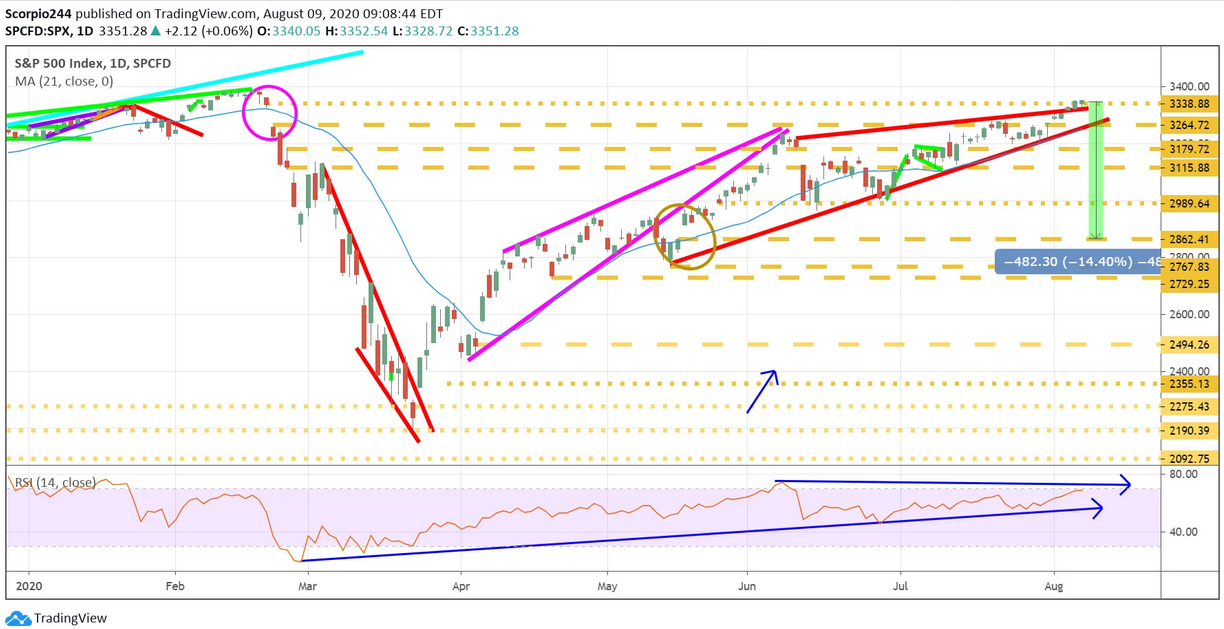
Two bearish patterns have formed in the S&P 500 one at the gap from February 24, and the second is a rising wedge, as I said on Friday to members if I had to pick a place and time for a pullback in the market it would be here and now. A drop below 3,260 on the S&P 500 could trigger a sell-off and gap fill in the index down to 2,860.
Tencent
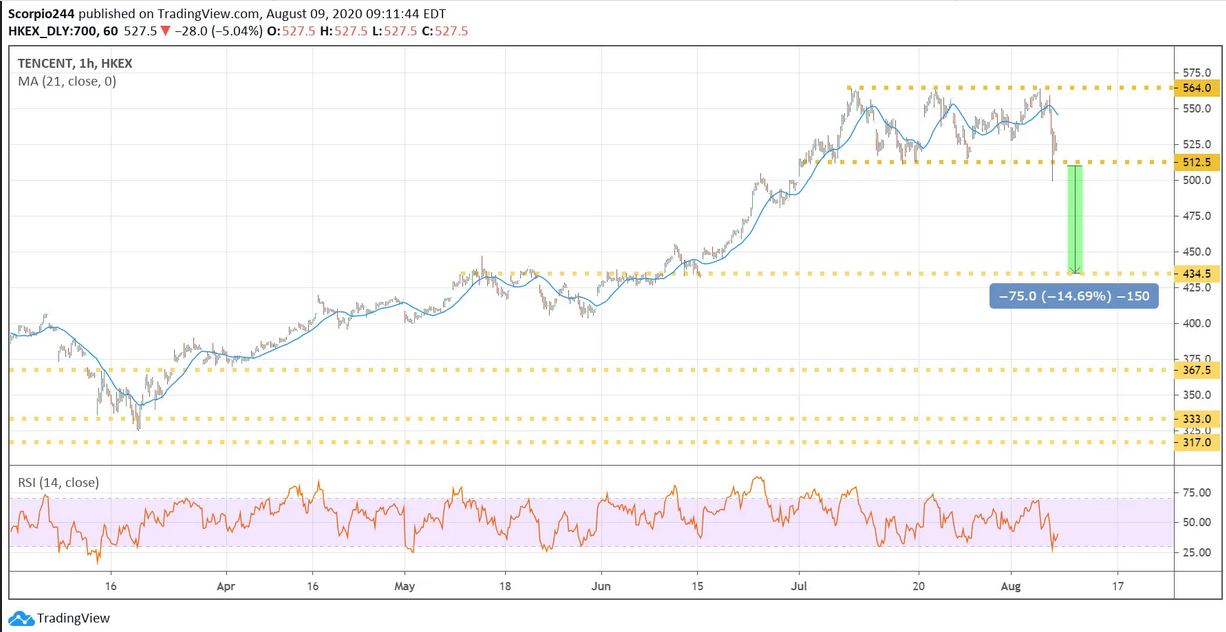
It isn’t just a rebounding dollar that could derail the risk-on trade, but Tencent Holdings Ltd (HK:0700) in Hong Kong could be a weight too. The stock has now failed three times at 564HKD, and a break of 512 could send the shares sharply lower to around 434.
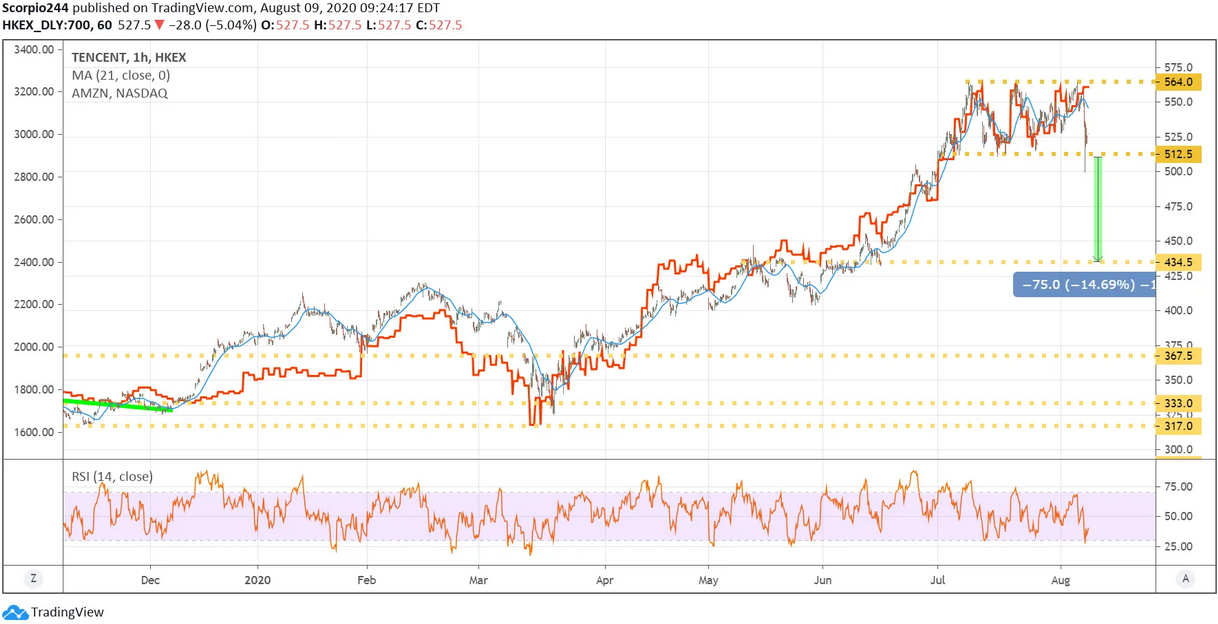
Why do we care so much about Tencent? Well, look at the overlay of the chart with Amazon (NASDAQ:AMZN), and you will see why. A breakdown in Tencent could trigger a decline in the entire global technology stock trade.
Amazon
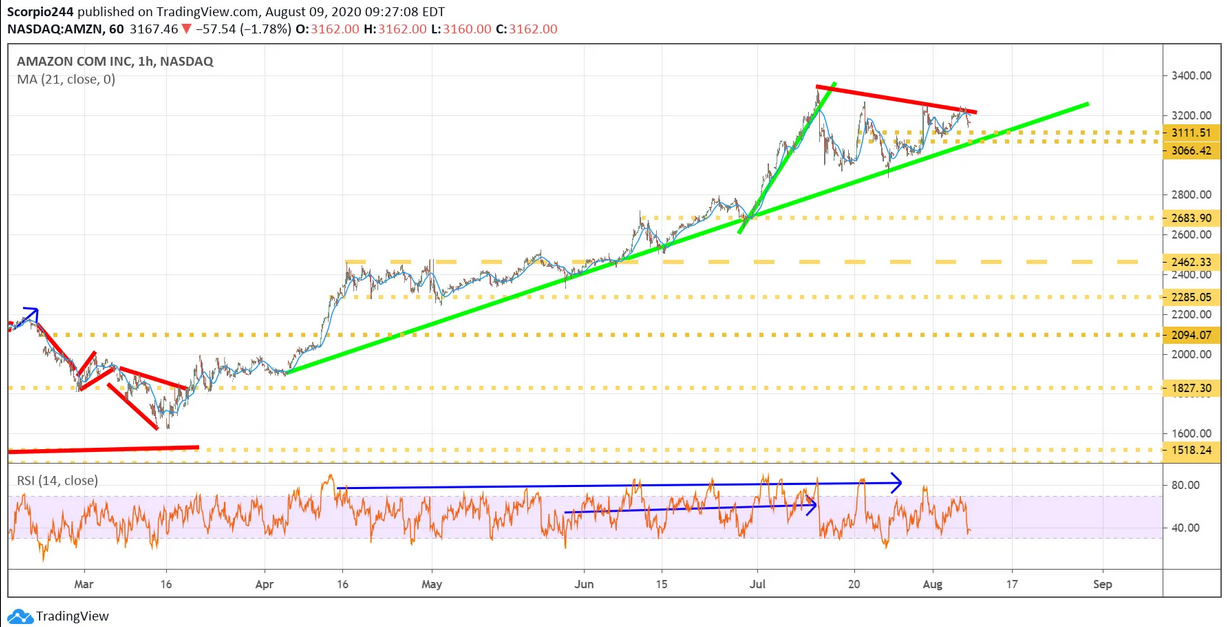
Amazon.com has struggled to advance despite strong quarterly results, and a break of that uptrend at $3,066 sends the stocks even lower to $2,685.
Netflix
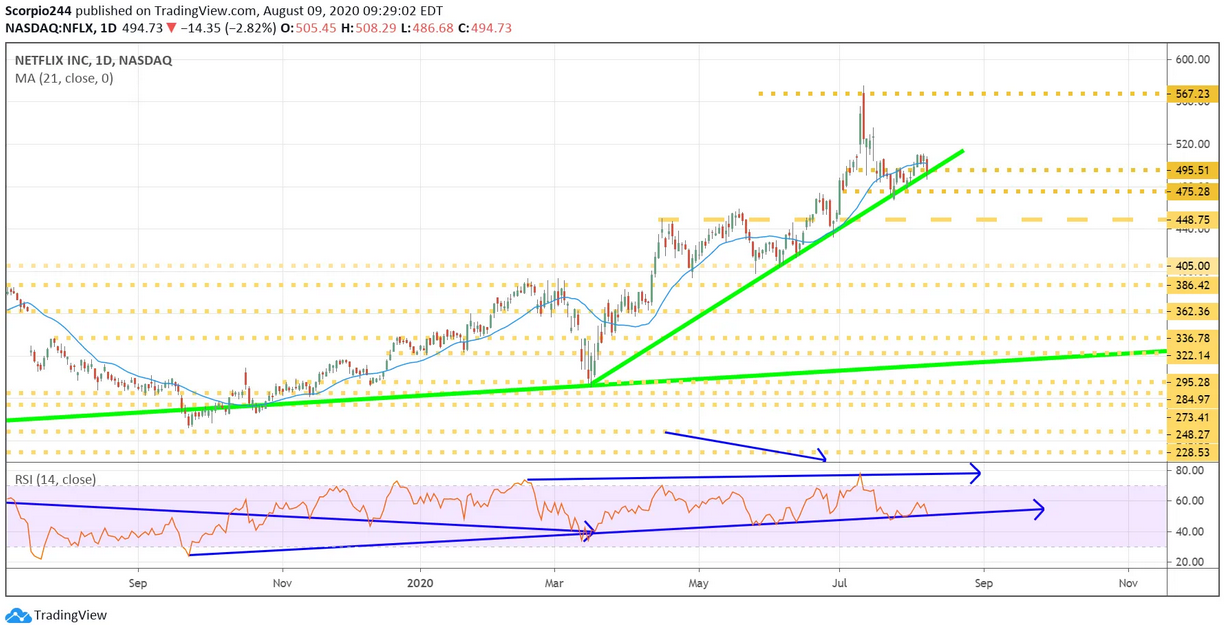
Netflix (NASDAQ:NFLX) came very close to testing its uptrend on Friday, and a break of support at $495 gets that trend line broken, and the potential for a move back to $450.
Tesla
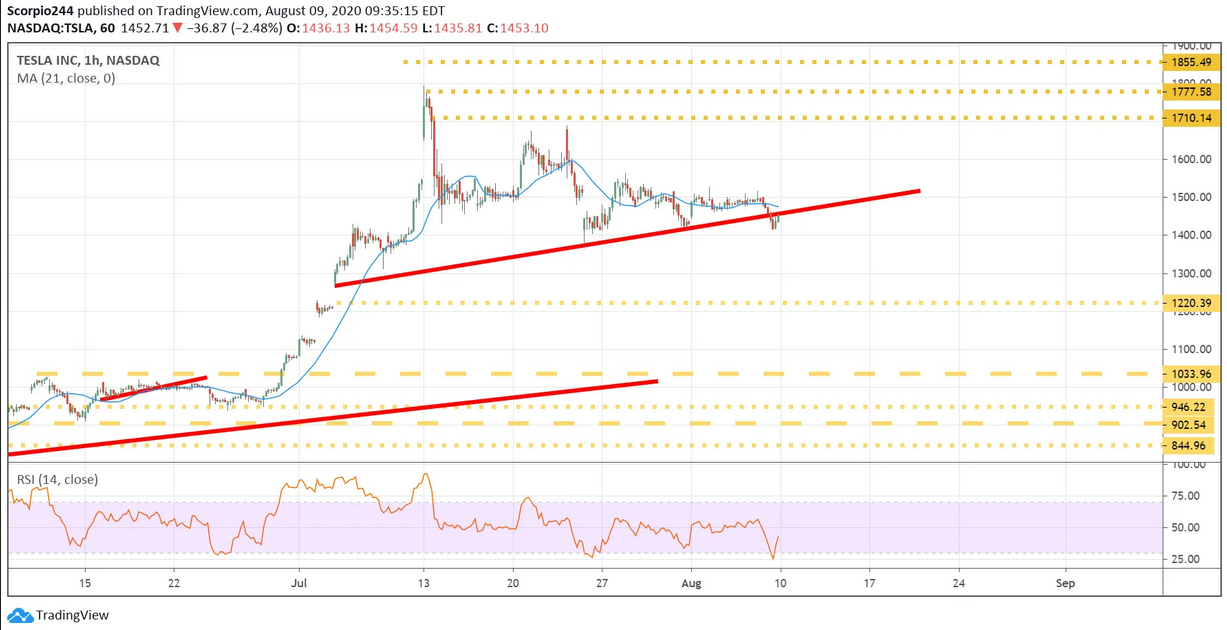
Tesla (NASDAQ:TSLA) could be in trouble here too, already falling below its uptrend, and the potential for the stock to fall and fill a gap around $1,225.
