The NASDAQ’s recent quick 11% slip earned the “correction” label. This alarmed many newbie investors who bought technology shares hoping they would keep heading higher.
We careful contrarians, on the other hand, welcome pullbacks like these. Being focused on income, we are now able to go shopping and secure more tech dividends per dollar.
The only “catch” is that we shouldn’t wait long to buy the bargain tech payers. Remember the NASDAQ’s bear market in late 2018? It bottomed out in less than three months.
The tech index sank even farther, much faster, in 2020, sinking 30% in just over a month. But buyers didn’t wait long, as they soon bid the NASDAQ up to the moon.
Valuations are a bit more reasonable, but we’re not looking at the index as a whole. Many of these stocks pay nothing, and collectively the dividend yield on the Nasdaq still sits below 1%:
A Little Longer-Term Perspective
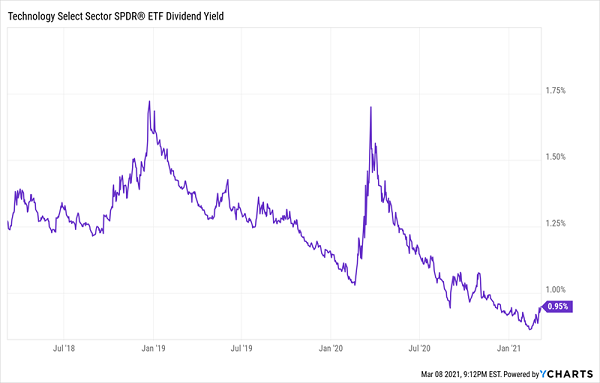
But that’s just an average. In the bargain bin we’re able to find many “grown up” tech plays that do provide a healthy yield. Here are nine of the biggest tech dividends today.
Which bargains should we buy, and which should we avoid? Let’s take a look.
The “Has-Bin”
Let’s start out with six names that very much belong in the “old tech” pile:
- Cisco Systems (NASDAQ:CSCO): 3.1%
- Juniper Networks (NYSE:JNPR): 3.3%
- Western Union (NYSE:WU): 3.7%
- Xerox (NYSE:XRX): 3.8%
- International Business Machines (NYSE:IBM): 5.2%
- NVE Corporation (NASDAQ:NVEC): 5.9%
Generally a 3%+ yield from the tech sector is generous. A 5.9% dividend is flat out gaudy. Problem is, these stocks all yield for a reason:
They have been dogs for a decade.
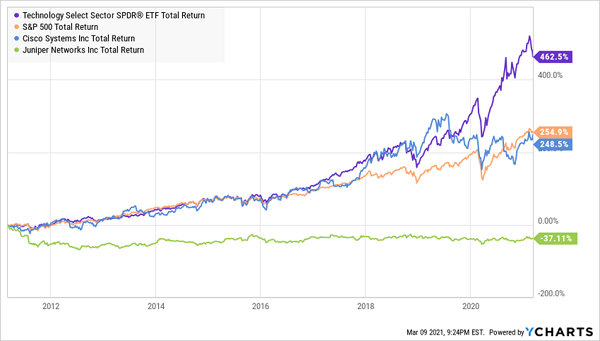
Of these six, only Cisco comes even remotely close to keeping up with the market. And I personally wouldn’t touch CSCO right now as it attempts to pivot its core business over to newer technologies. Juniper, meanwhile, was the biggest loser of the group:
Even “Best” Payer Cisco Trailed Tech Sector, S&P 500
Not one of these companies is expected to record top-line growth of more than 6% in 2021. And in 2022, analysts are projecting revenue growth below 4%. In tech we generally like to see top line sales that are available to power the payout higher—this six-pack is empty on revenue catalysts.
7. NetApp: A Better Breed
These three tech dividends look a bit more attractive, however. NetApp (NASDAQ:NTAP) provides hybrid cloud data services as well as data management. It’s suffering from declining storage hardware sales—which are being hurt in part by microchip shortages you’ve surely heard about lately—but fortunately, software sales growth is picking up the slack.
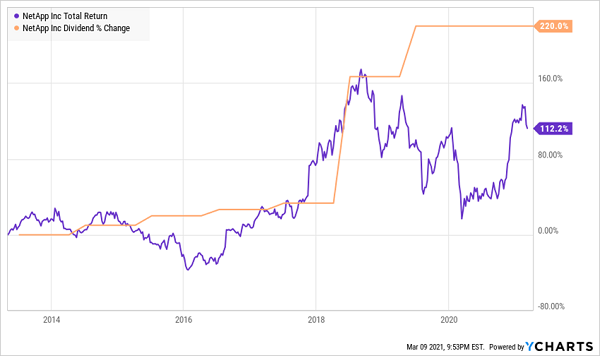
Growth expectations aren’t great, at mid-single-digits for the next two years. But a forward P/E of 14 appears reasonable. Importantly, while dividend growth slowed in the wake of COVID-19, the stock seems to faithfully “track” its dividend. That means it has some catching up to do, and that could get more aggressive once NTAP’s dividend growth resumes.
NetApp Shares Due to Catch Its Dividend?
Hewlett Packard Enterprise (NYSE:HPE, 3.2% yield) was spun off from HP (NYSE:HPQ) in 2015. After spinning off a few of its own businesses in subsequent years, the remaining HPE includes cloud, hybrid IT, networking and financial services, among other offerings.
While HPE is similar to the prior six companies in that top-line projections are pretty modest, the company is expected to grow profits by 40% over the next two years, and it trades for a song. We can currently buy Hewlett Packard Enterprise shares for less than 9 times forward earnings, and for a price/earnings-to-growth (PEG) ratio of just 0.82. (Remember: PEGs below 1 indicate a stock is undervalued.)
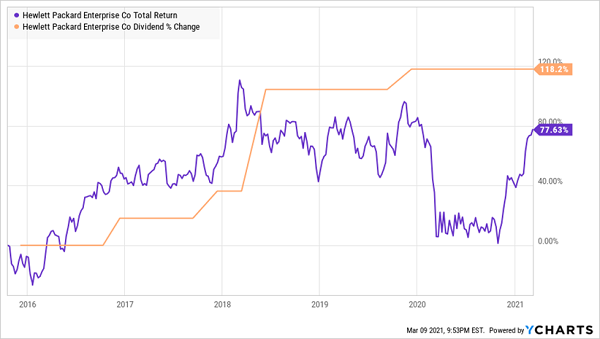
Again, shareholders have rewarded HPE’s dividend growth in the past, and a return to normalcy could go a long way in keeping its current bout of momentum going.
8. HPE Needs to Push the Pedal Back Down
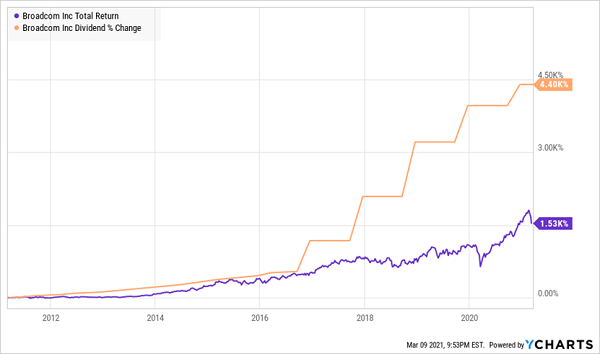
But the dividend chart that really catches my eye is semiconductor maker and infrastructure software provider Broadcom (NASDAQ:AVGO).
9. Broadcom Shares Have Room to Run
As mentioned before, the world is caught up in a massive semiconductor shortage, which makes semiconductor companies a good business to be in right now.
But even once supply has caught up, chips are only becoming more ubiquitous, increasingly governing even the most basic of human needs. Broadcom’s specific positioning in mobility and the data center sets it up for years of red-hot demand. While WFH trends might subside somewhat as vaccinations hit full stride, the advent of 5G and the entrenchment of trends such as working from home and TV/video game streaming remain winds at Broadcom’s back.
And just take another look at that underappreciated dividend growth. Broadcom’s payout has grown from 7 cents per share in December 2010 to $3.60 per share as of its March 2021 payout. Even its last payout bump, from $3.25 per share, was a respectable 11%.
Disclosure: Brett Owens and Michael Foster are contrarian income investors who look for undervalued stocks/funds across the U.S. markets. Click here to learn how to profit from their strategies in the latest report, "7 Great Dividend Growth Stocks for a Secure Retirement."
