Investing.com’s stocks of the week
It will be a big week for the stock market as earnings season kicks into high gear. We will get results from all the big banks starting on Tuesday, and how these results go could begin to set the tone for the balance of the summer.
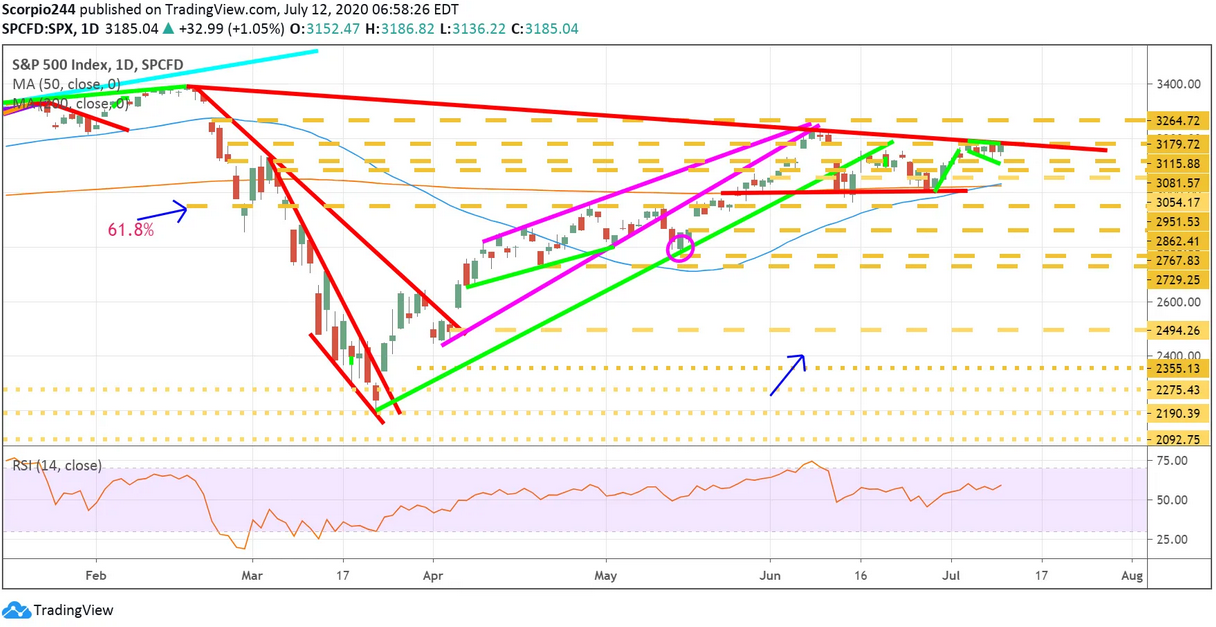
1. S&P 500
The S&P 500 is in an interesting spot, right now battling a downtrend that started in February, while at the same time showing some bullish trends. The chart currently shows a bull flag pattern has formed on the daily chart over the last two weeks, and if the index can manage to push through that resistance level around 3,180 and the downtrend, then I think it has an excellent chance to race back to 3,265. If it can’t, then we are looking at a drop back to 3,115.
The worst-case scenario would be for the market to give a false break out on Monday. Meaning we push higher, only to drop sharply on Tuesday and the rest of the week. It is too close to call at this point what happens.
2. JPMorgan
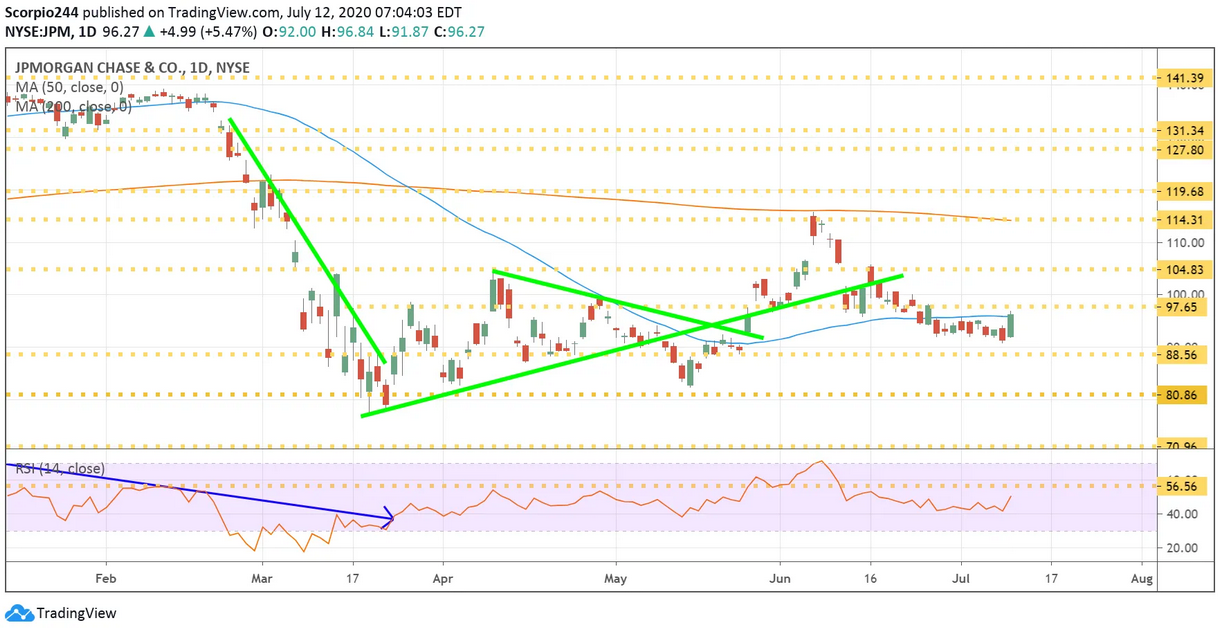
JPMorgan (NYSE:JPM) will report results on Tuesday, and the stock is very close to breaking out, and that means results can send shares higher to $104. I also saw some bullish betting during the week that suggests the stock will rise in the weeks following results.
3. Qualcomm
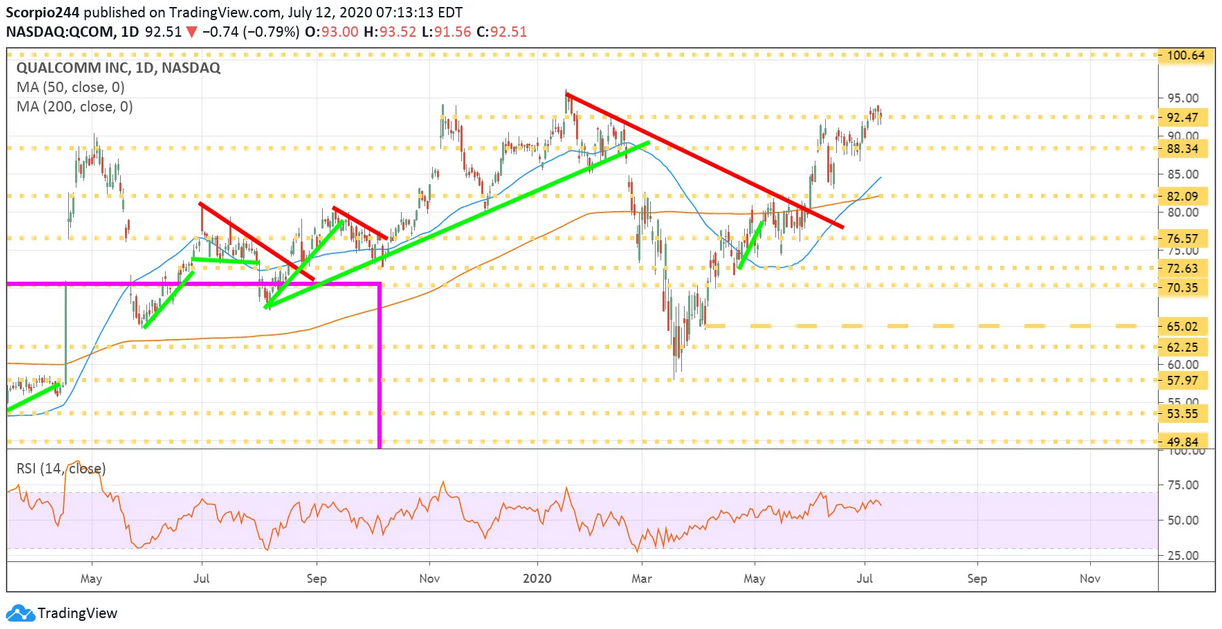
Qualcomm (NASDAQ:QCOM) may be starting to top out here. We can see that it broke that downtrend a while back but has struggled to advance beyond $93. The RSI is also starting to lose some momentum, so perhaps it drops back to $88.
4. Micron
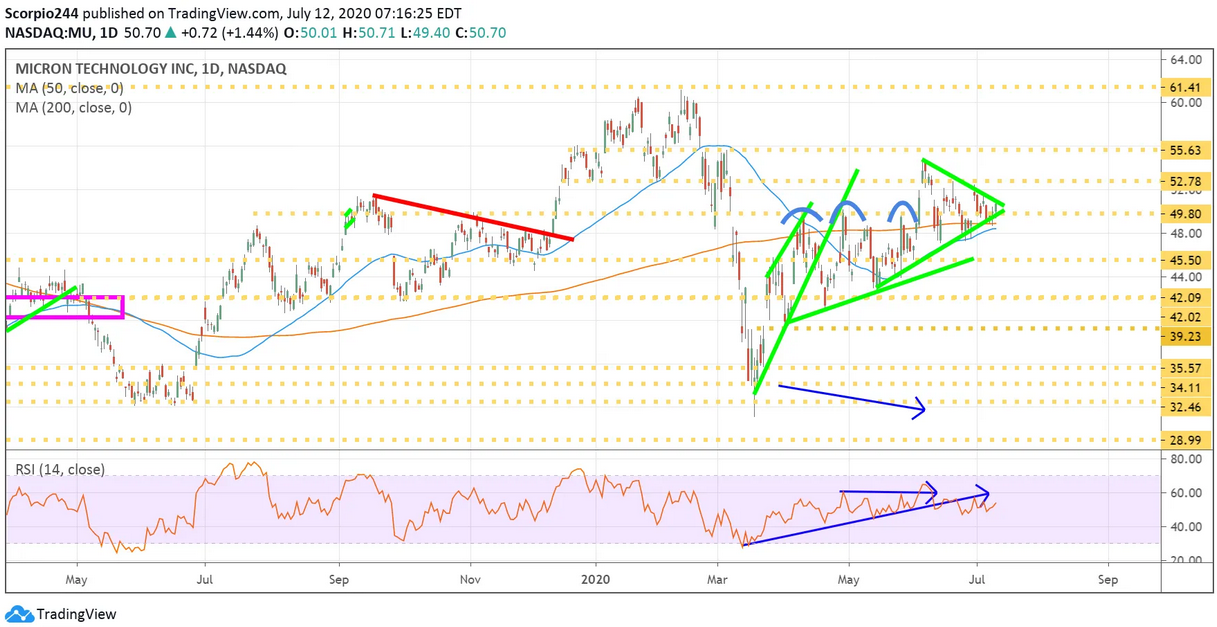
Micron (NASDAQ:MU) never got to that $45.50 level I thought it might get too, but it never ran up either. Now the stock appears it is going to decide what happens next finally. It seems this time it breaks higher, out of that triangle pattern, pushing to $52.75.
5. Netflix
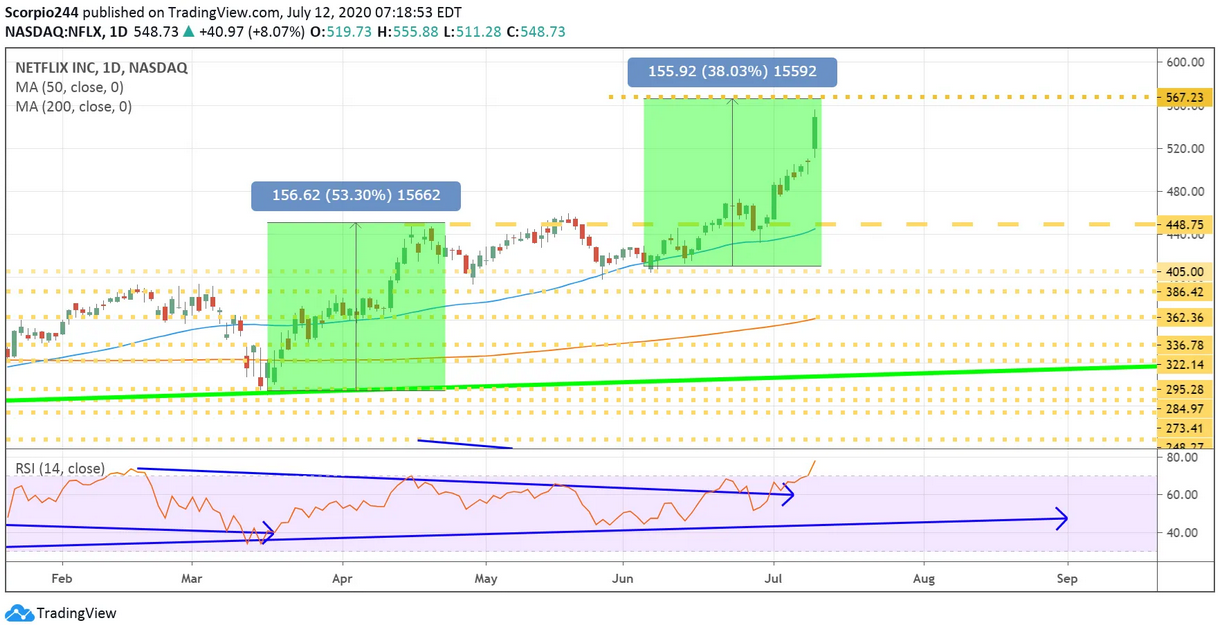
Netflix (NASDAQ:NFLX) will report results this week, and I will on the lookout for options activity on this one, so check back. It seems the stock may still have a bit further to rise before it runs out of juice and turns lower. Look for a push up to $570.
6. Facebook
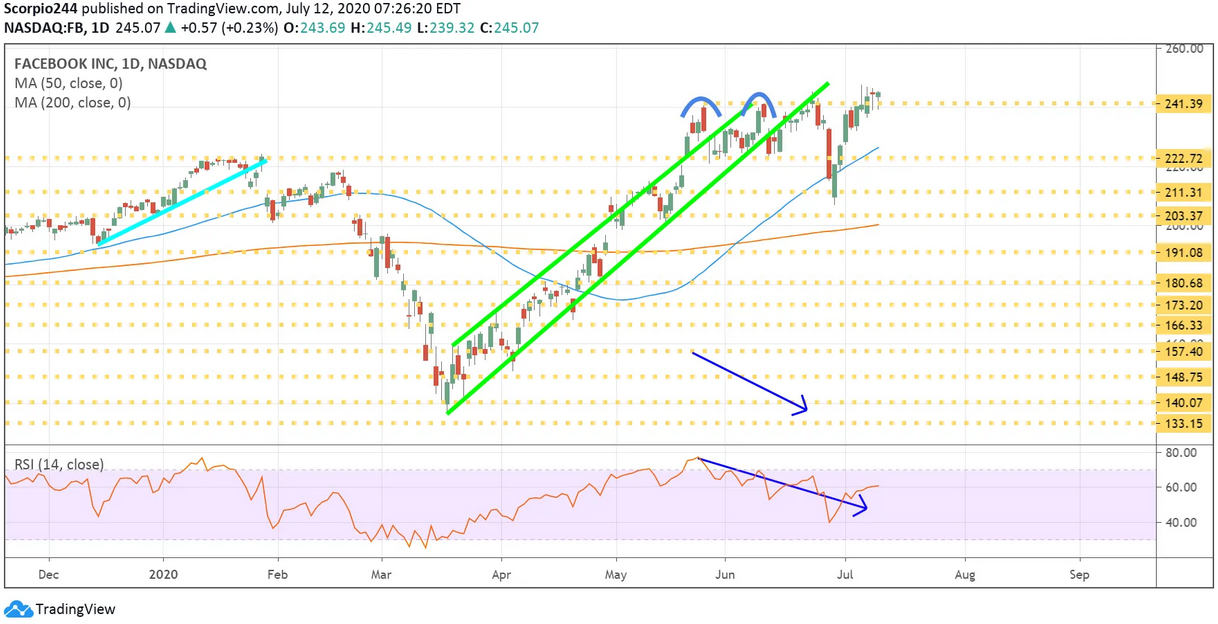
What happens if some of these advertisers who are boycotting Facebook (NASDAQ:FB) find out that they can do alright without it. That’s a significant risk, isn’t it? While it is unlikely advertisers don’t come back, who to say they don’t come back differently. We just don’t know? It has happened before. Perhaps that is why the stock is struggling around resistance at $242. I still contend the stock trades lower, back to $222.
7. Amazon
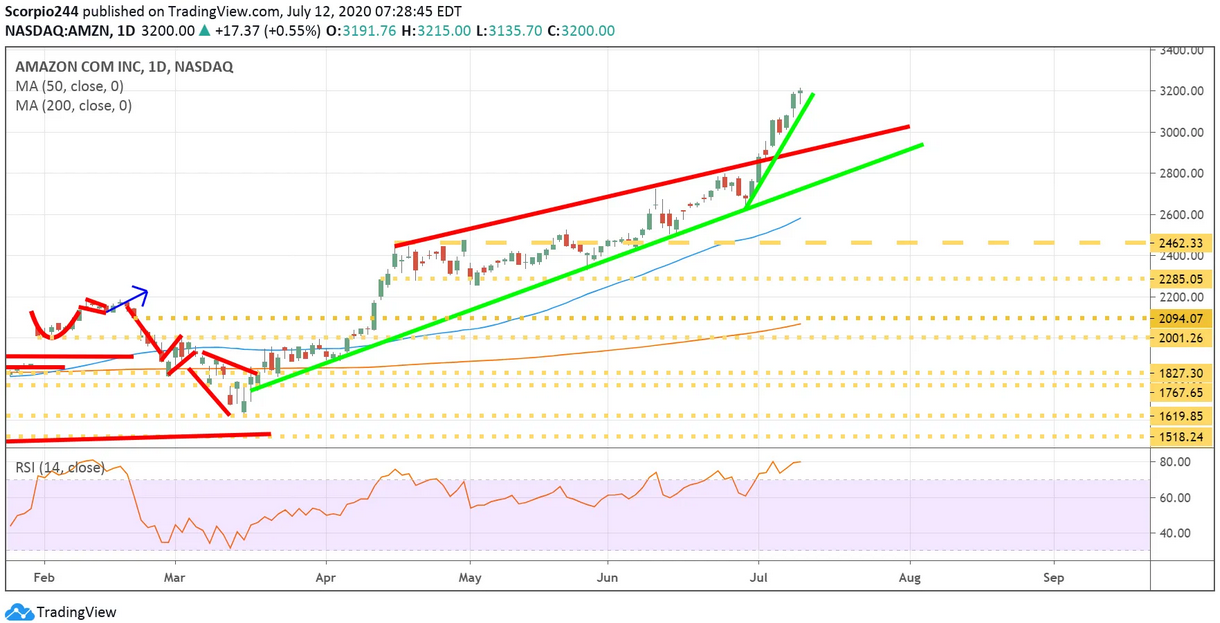
I thought Amazon (NASDAQ:AMZN) would be on its way back to $2,285, I still believe that is possible, but it will likely have to wait until after earnings, based on the current chart. However, I think it can drop back to 2750 before earnings.
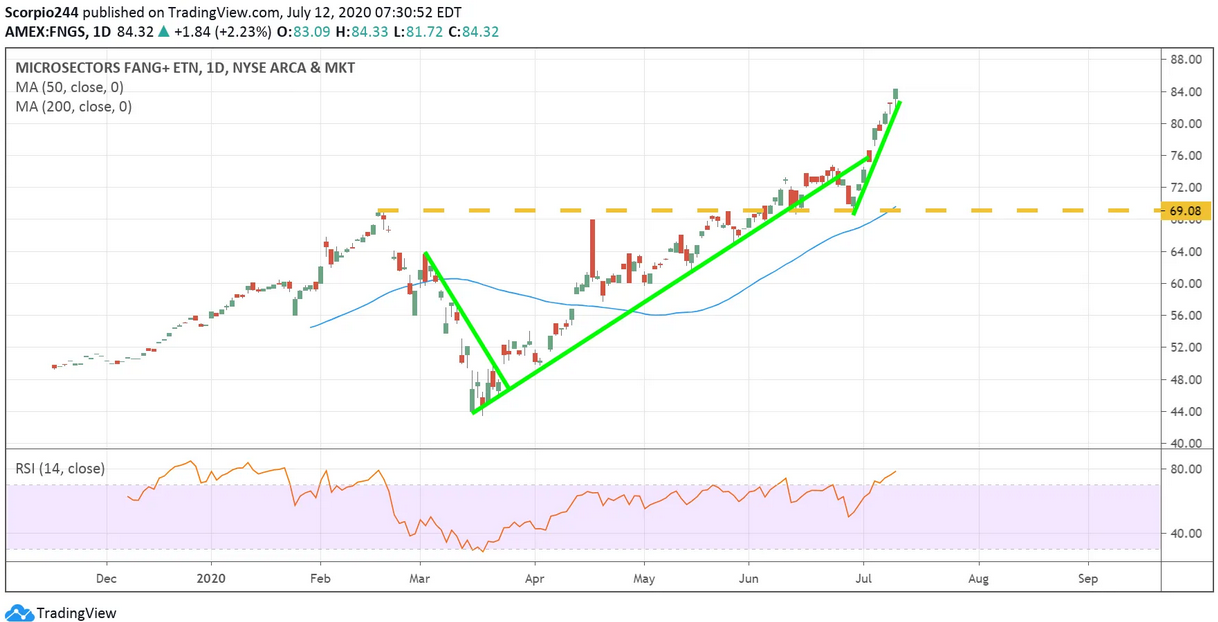
8. FANG+ (FNGS)
One reason, I think Amazon can pull back. Just look at the fear trade taking place in FANG+™ ETF (NYSE:FNGS). It has gone parabolic, and how long can that last. A break of the uptrend quickly sends it back to $69, along with all the components with it.
