8 Monster Stock Market Predictions For The Week Of December 30

Published 12/30/2019, 12:27 AM
Updated 11/16/2024, 07:53 AM
US500
-
CAT
-
AMZN
-
NVDA
-
SBUX
-
NFLX
-
TSLA
-

S&P 500 (SPY)

Stocks will try to advance once again, in the New Year shortened trading week. The S&P 500 closed around 3,240 on Friday, and it leaves the next level of resistance around 3,255. The index finds itself in overbought territory with an RSI at 78.4, which is too high. The index is likely to continue to climb over the next several weeks, but it needs to fall by 1-2% and soon to get the RSI below 70 again. Let’s hope that we can get a pullback this week. Preferably, back to around 3,200, which would be support.

S&P 500 Index

Amazon (AMZN)

Amazon (NASDAQ:AMZN) had a good week rising to resistance around $1,890. The stock failed at that resistance level and is likely to retest support this week around $1825.
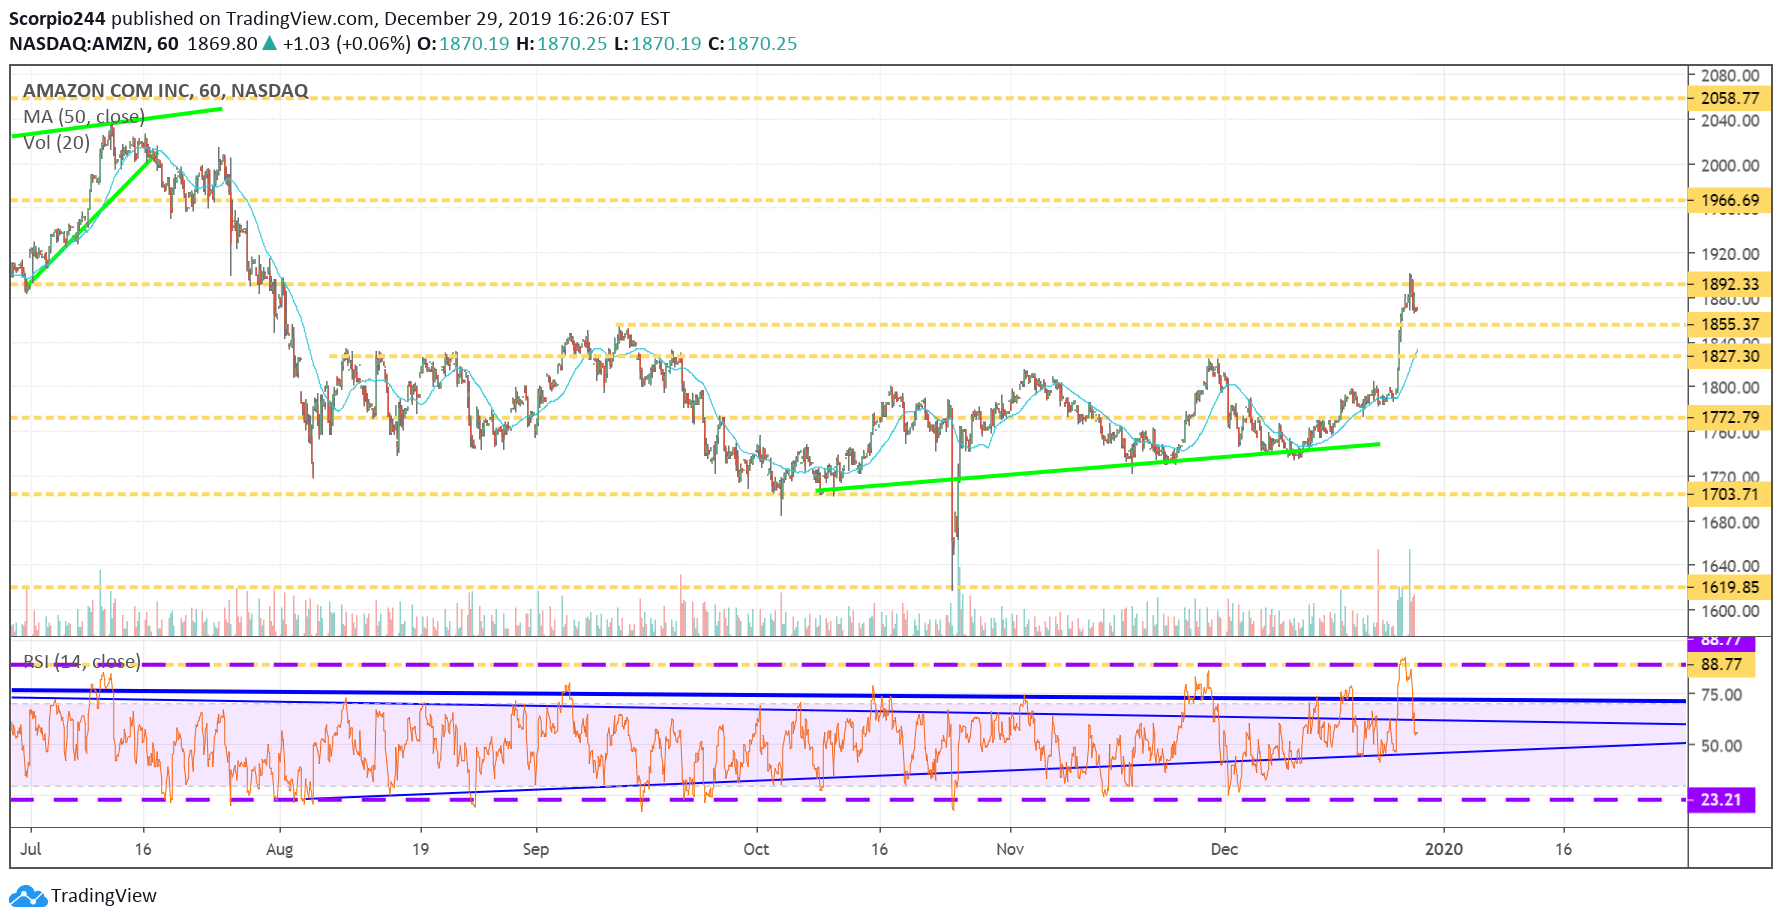
Amazon Inc Chart

Tesla (TSLA)

Tesla (NASDAQ:TSLA) has had no leaked emails about production or delivery rates, which is surprising. I can’t remember the last time a quarter was complete without a leak. If the stock pulls back, this is likely to be the week. But with no leaked emails, the only question is what investors’ expectations are for deliveries. Should the stock fall, $420 is the first support level, followed by $406 and then $390. We find out what those delivery numbers are no later than January 3.
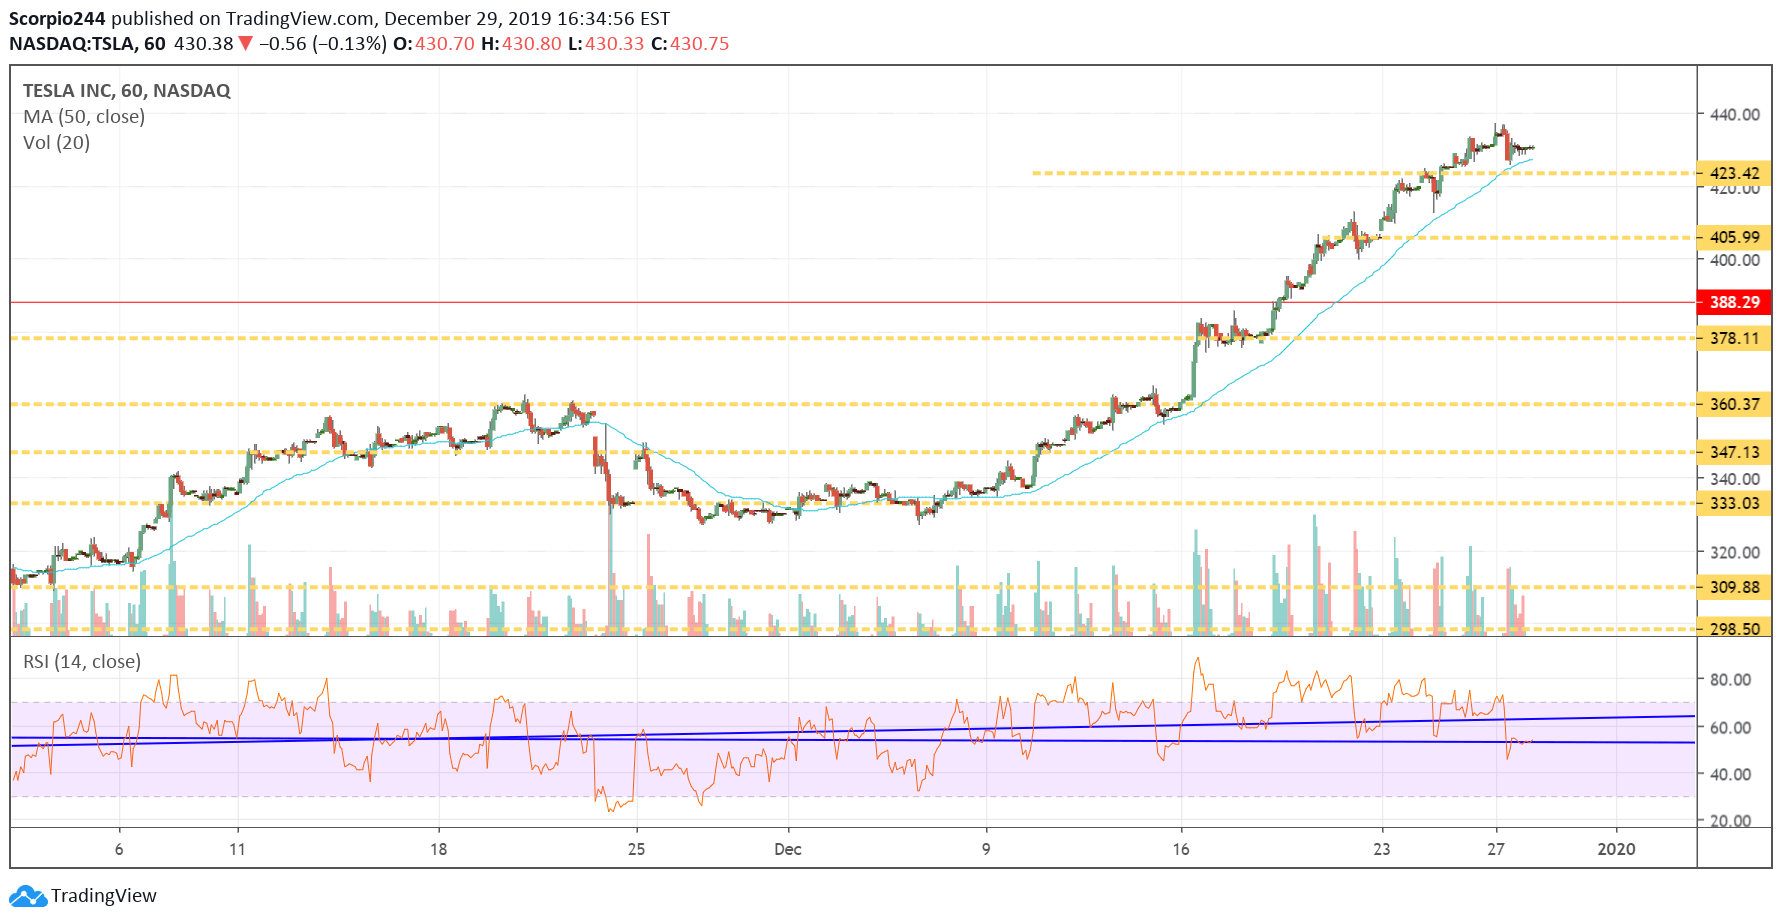
Tesla Inc Chart

NVIDIA (NASDAQ:NVDA)

NVIDIA Corporation (NASDAQ:NVDA) is flirting with support at $236, a drop below support sends the stock back to $225.
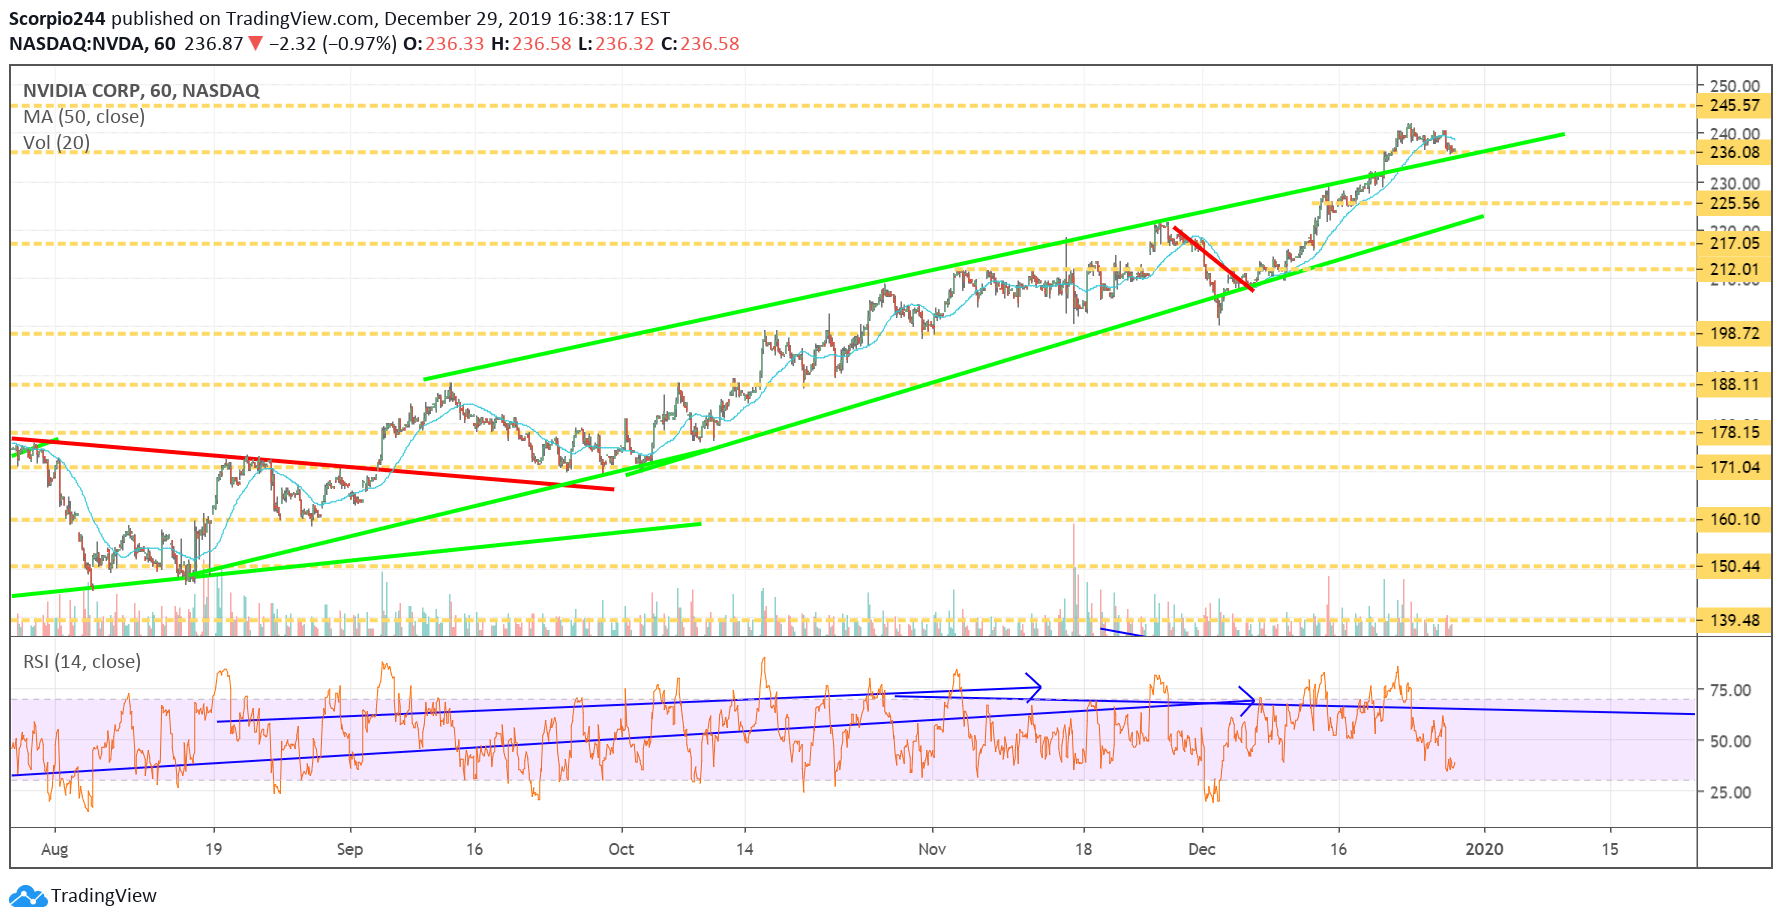
Nvidia Chart

AMD (AMD)

AMD looks like it may be double topping, and drop below $45.50 gets the stock heading back to 42.95.
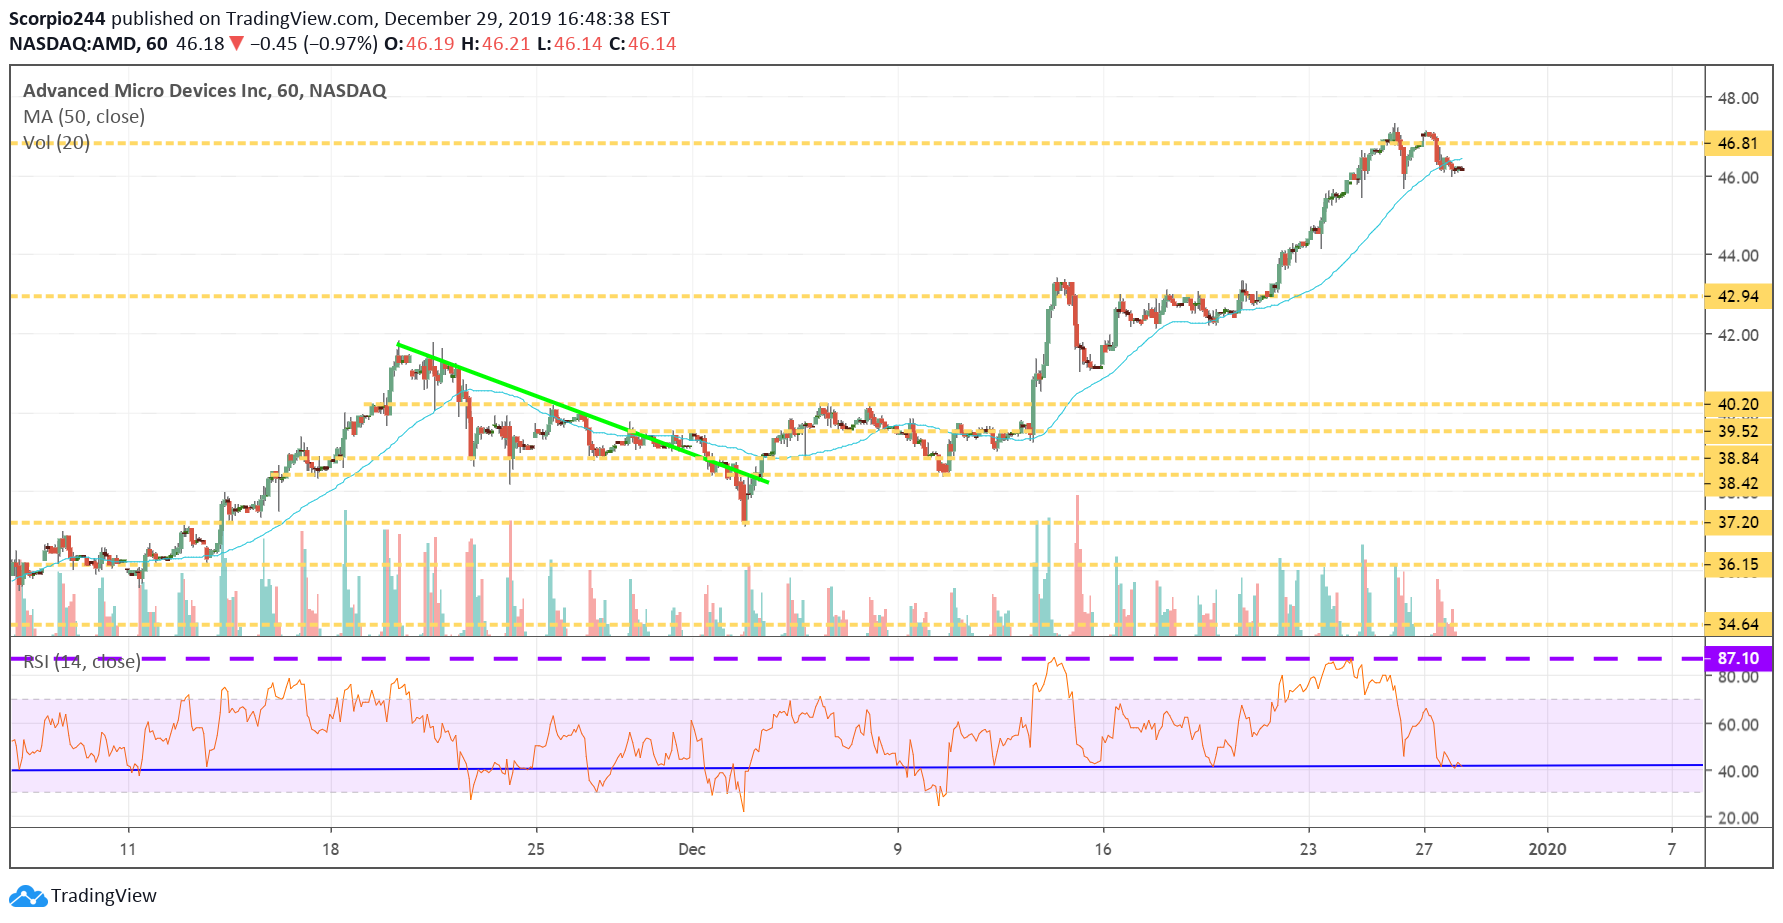
AMD Inc Chart

Netflix (NFLX)

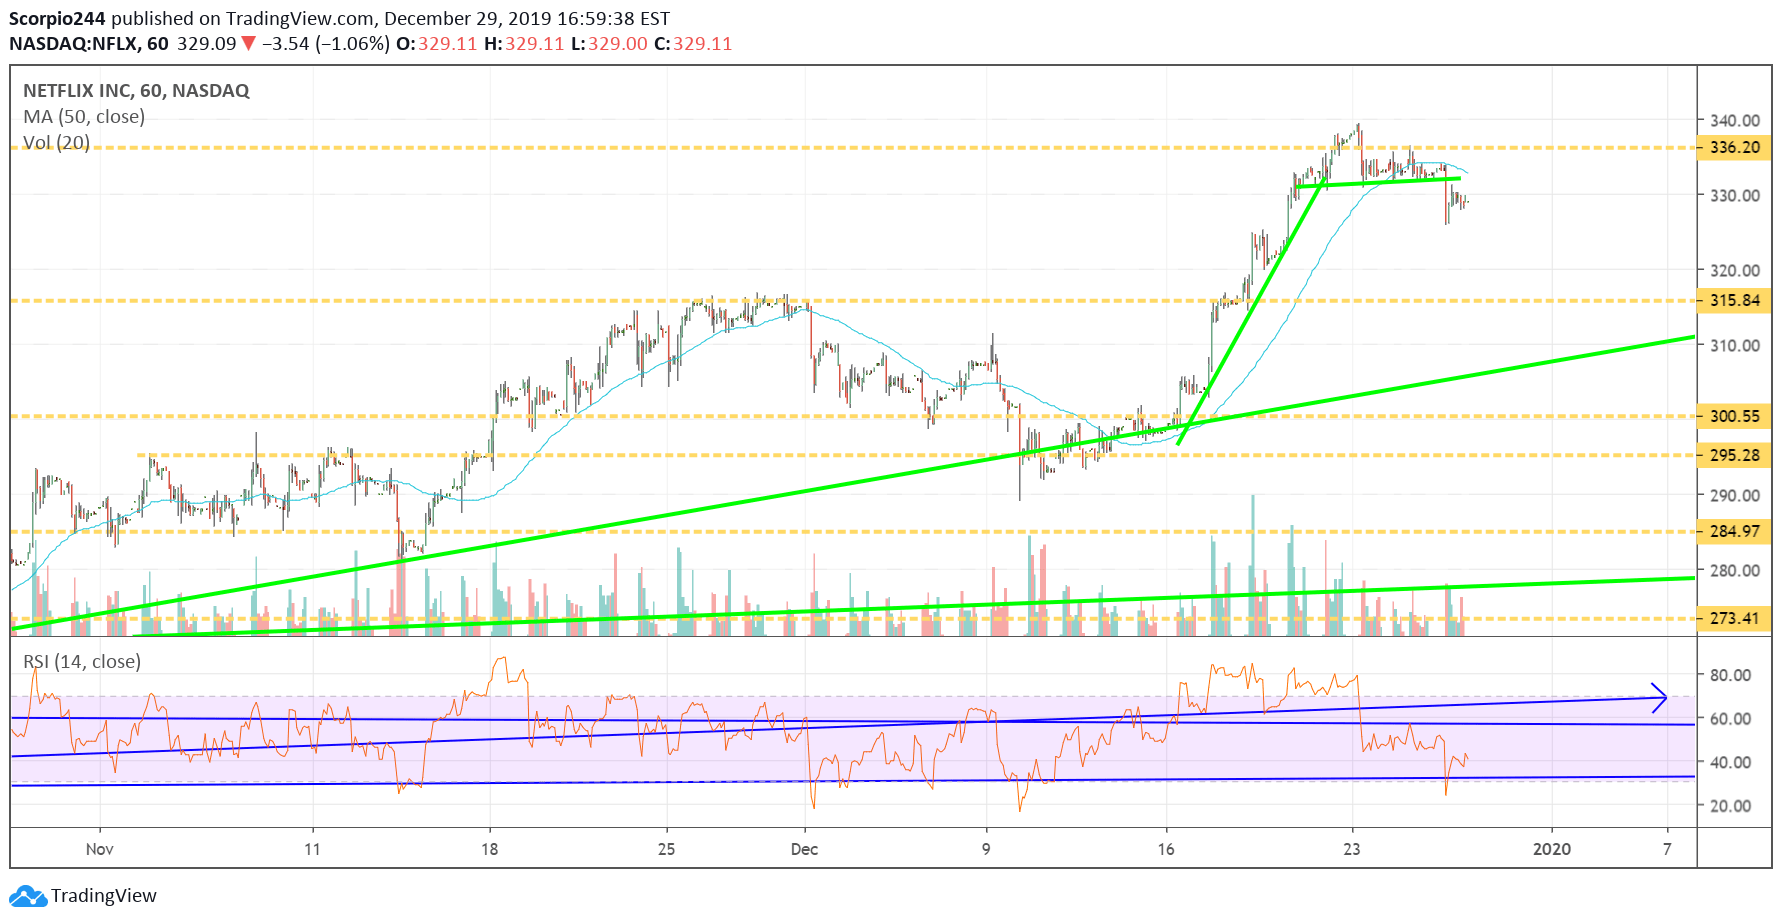
Netflix (NASDAQ:NFLX) is falling, and support doesn’t come until $315.
Netflix Inc Chart

Caterpillar (CAT)

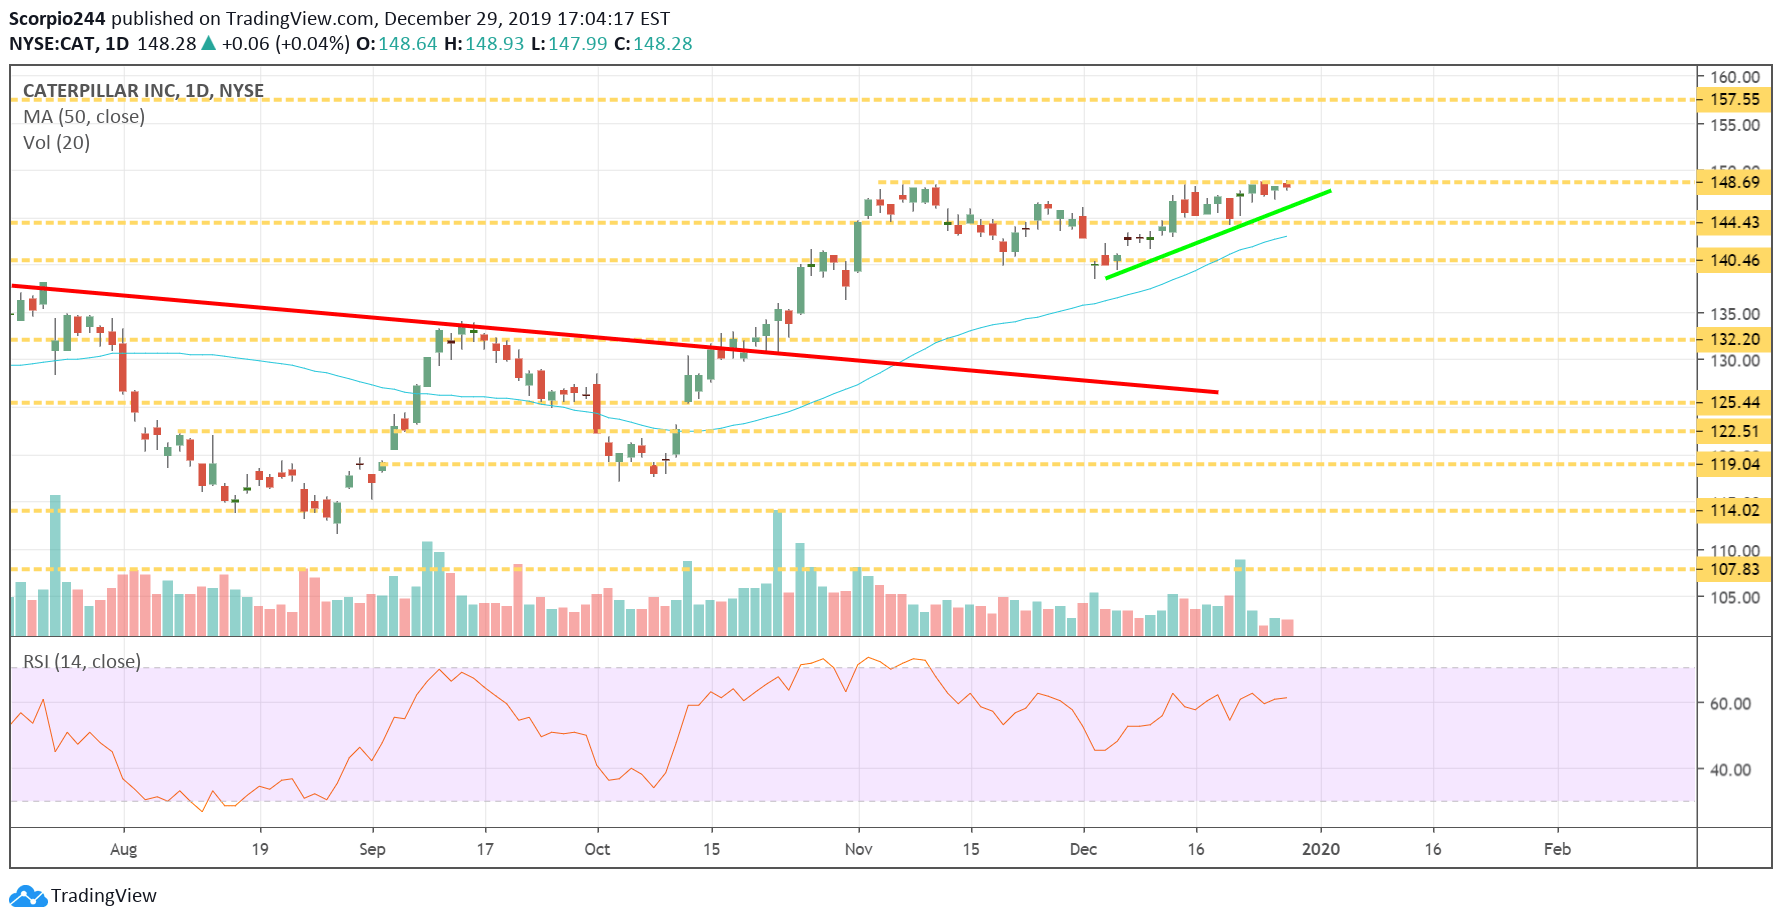
Caterpillar (NYSE:CAT) looks like it may be forming an ascending triangle, and it may be ready to rise to around $157.50.
Caterpillar Inc Daily Chart

Starbucks (SBUX)

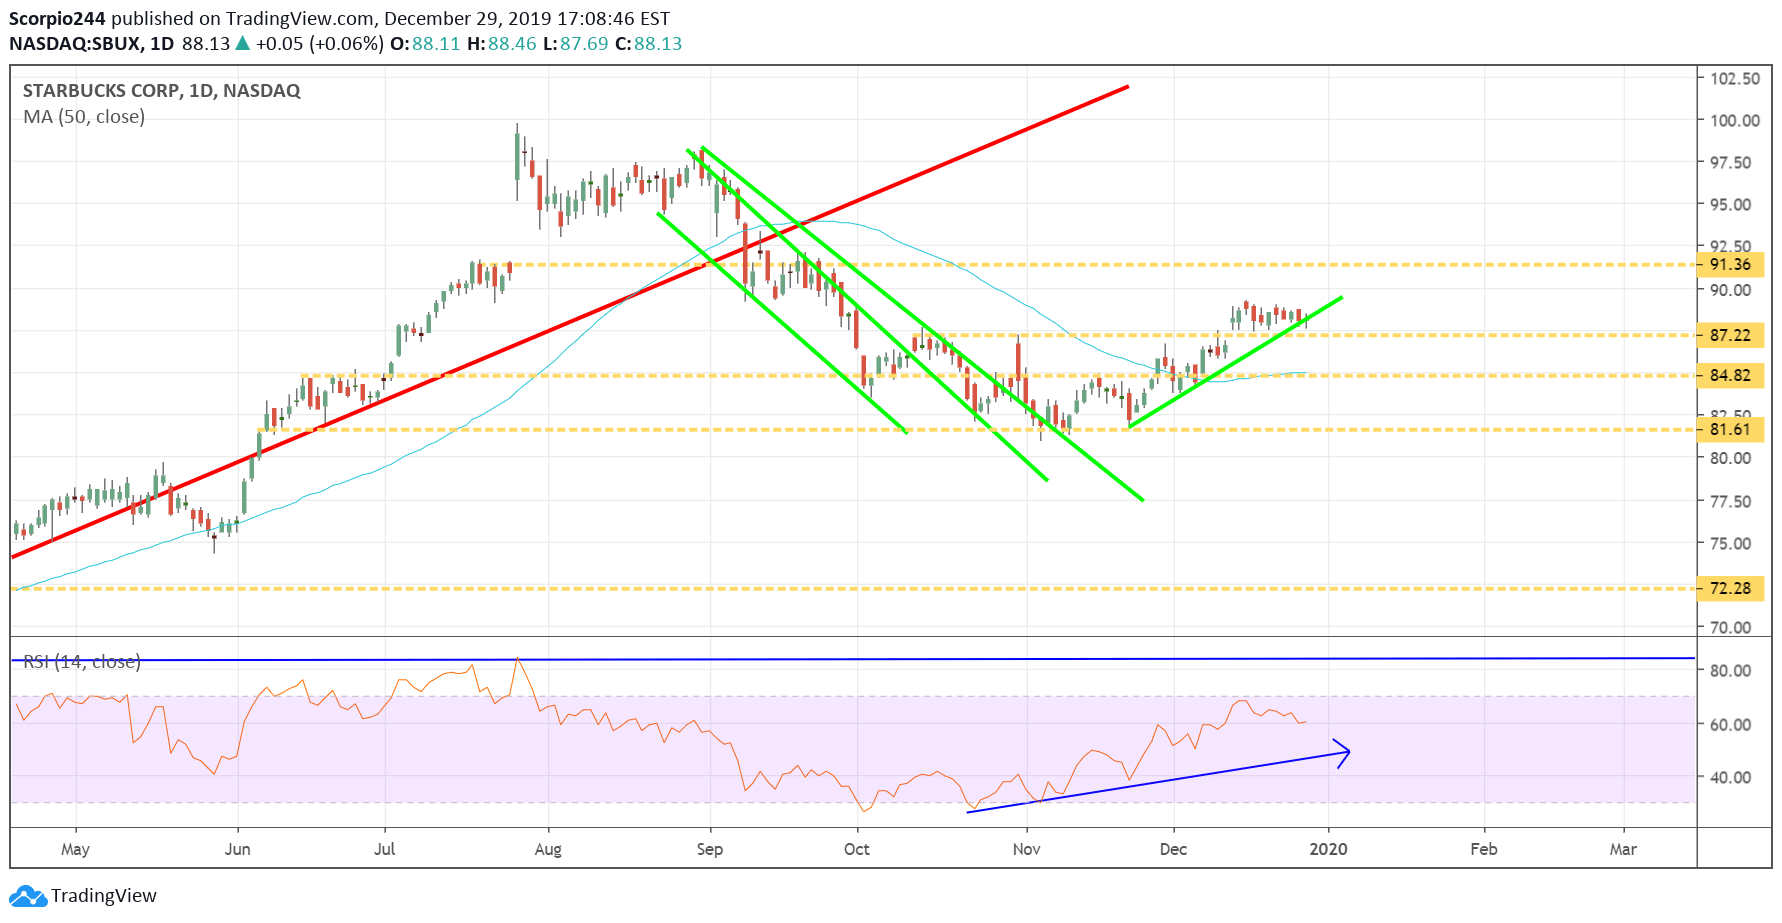
All signs are pointing to Starbucks (NASDAQ:SBUX) rising to around $91.50
Starbucks Daily Chart

Original Post

Latest comments

Loading next article…
Risk Disclosure: Trading in financial instruments and/or cryptocurrencies involves high risks including the risk of losing some, or all, of your investment amount, and may not be suitable for all investors. Prices of cryptocurrencies are extremely volatile and may be affected by external factors such as financial, regulatory or political events. Trading on margin increases the financial risks.
Before deciding to trade in financial instrument or cryptocurrencies you should be fully informed of the risks and costs associated with trading the financial markets, carefully consider your investment objectives, level of experience, and risk appetite, and seek professional advice where needed.
Fusion Media would like to remind you that the data contained in this website is not necessarily real-time nor accurate. The data and prices on the website are not necessarily provided by any market or exchange, but may be provided by market makers, and so prices may not be accurate and may differ from the actual price at any given market, meaning prices are indicative and not appropriate for trading purposes. Fusion Media and any provider of the data contained in this website will not accept liability for any loss or damage as a result of your trading, or your reliance on the information contained within this website.
It is prohibited to use, store, reproduce, display, modify, transmit or distribute the data contained in this website without the explicit prior written permission of Fusion Media and/or the data provider. All intellectual property rights are reserved by the providers and/or the exchange providing the data contained in this website.
Fusion Media may be compensated by the advertisers that appear on the website, based on your interaction with the advertisements or advertisers.
© 2007-2025 - Fusion Media Limited. All Rights Reserved.