Michael Kramer and the client of Mott Capital own shares of Netflix (NASDAQ:NFLX) and NXPITrade War- Same Old Story
I said this morning that I didn’t think today’s sell-off would last and still don’t. There was undoubtedly a great deal of noise out there today about the trade war for about the 1,000th time. It is getting old. It’s been a year now. Trump isn’t going to meet Xi until after the deadline, so the market goes down. I don’t remember Trump meeting XI as ever being part of the plan, or being a definite? Do they both have to meet? Do they not have phones? Is it possible for a deal between the two countries to be worked out by the deadline in principal and then signed in April? Or Maybe March 2?
How could Trump met Xi before the deadline? He is meeting Kim on the 27th and 28th, duh, in Vietnam. Probably would make sense for him to swing by Beijing on the way home. Maybe that will be on March 2nd. Who knows! Who cares. All of this is just noise. Trump doesn’t want to enter 2020 with the economy in doubt or a trade war still looming. He wants this settled, so he can add this to his list of achievements. He also doesn’t want the stock market to go down, that is his Job approval rating.
Europe
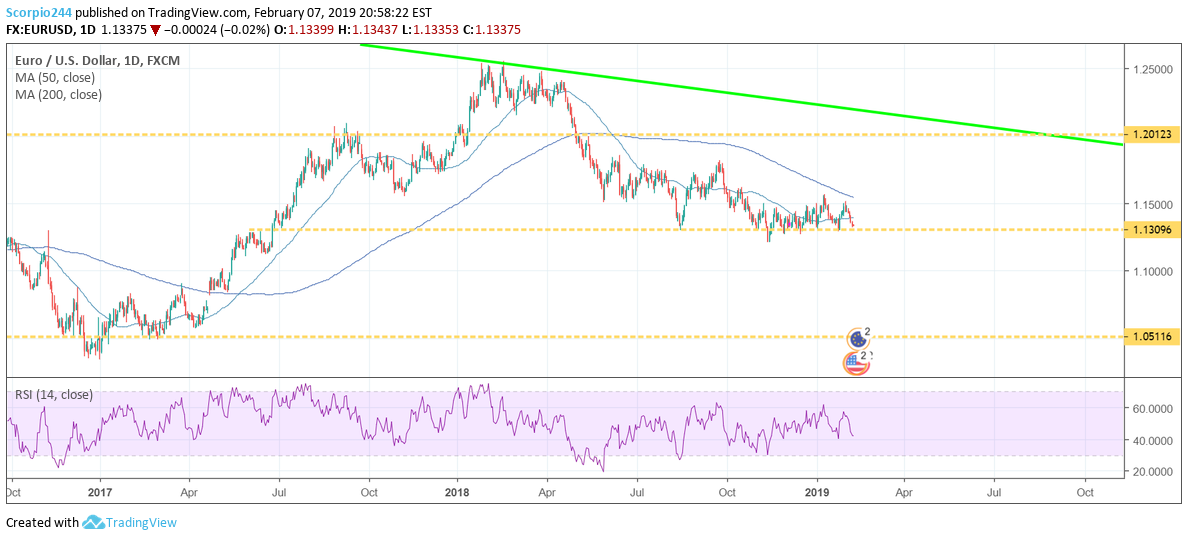
Then the other piece of news sending markets lower? Get this –Europe’s economy is weakening. Yeah really, Europe’s economy is slowing. No duh, it is slowing. Draghi said that like two weeks. It has slowed for months. It is lagging so much that the euro is once again on the cusp of a significant break down at 1.13 to the dollar.
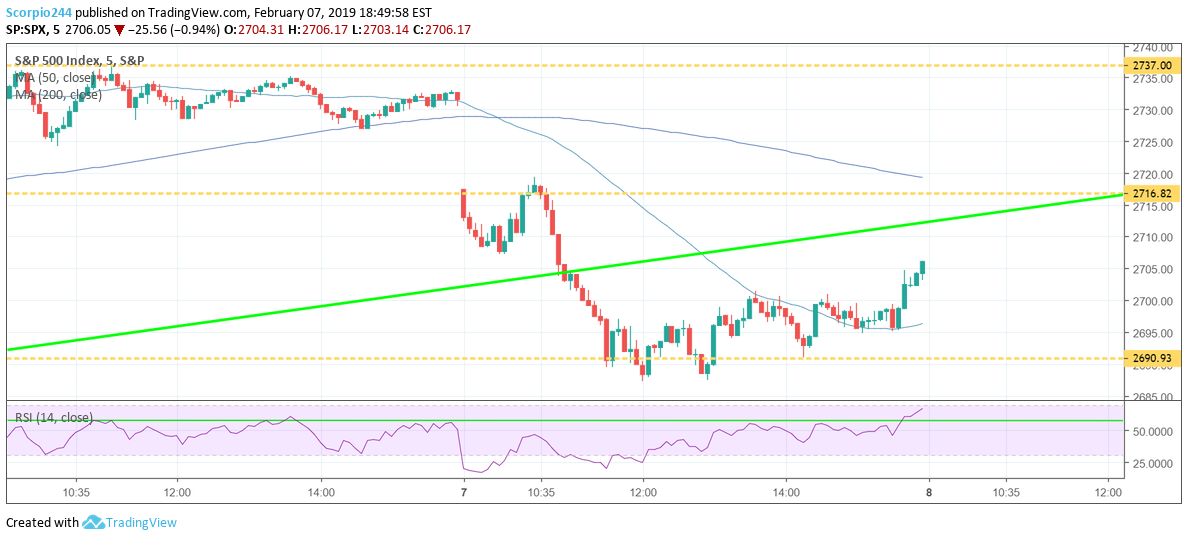
Do I think the market sell-off will continue? No. I do not. Sorry bears, you had your chance to take charge, and you completely blew it. The charts don’t lie. Watch.
S&P 500 (SPY (NYSE:SPY)
This morning I note two levels of support, the first at 2,716 and the second at 2,690. The first one held briefly until the trade war bs. But as we can see the 2,690 held just fine. Support was so strong at 2,690 that it tested that level, not once, not twice, not thrice –but four times! It held 2,690 four times! Four…
NASDAQ (NASDAQ:QQQ)
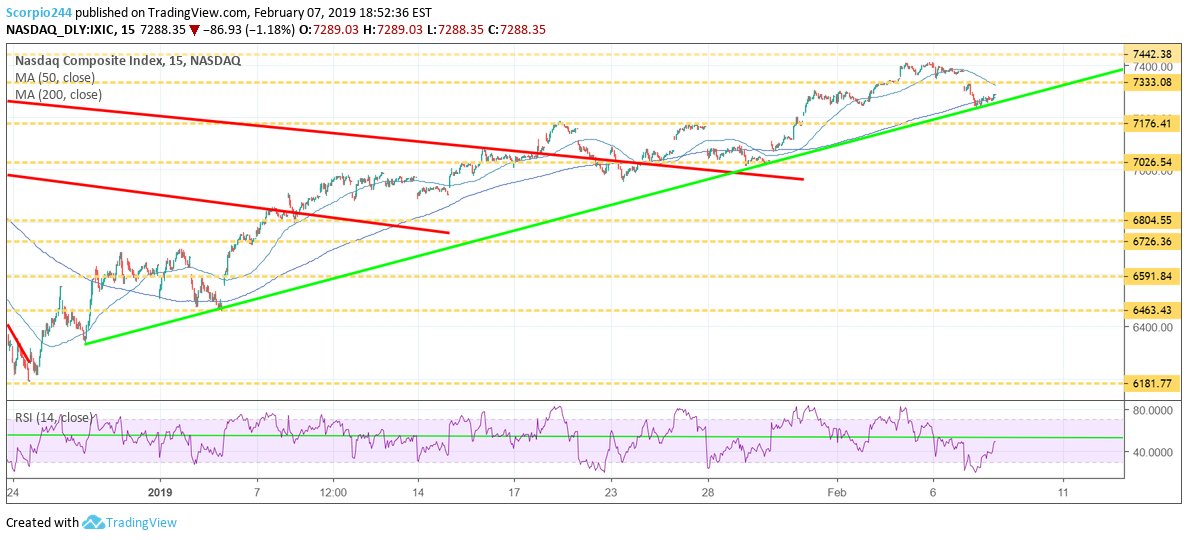
Move to exhibit 2 the NASDAQ. It found support right where it should a the uptrend.
Russell 2000 (NYSE:IWM)
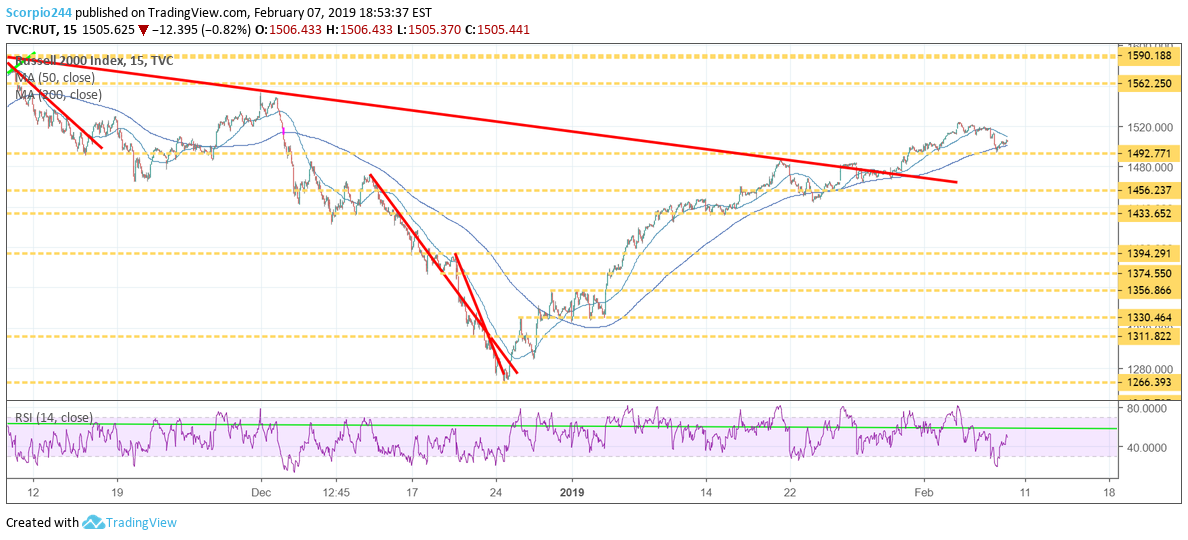
Exhibit 3, the Russell 2000, which also fell to support around 1,492 and held firmly.
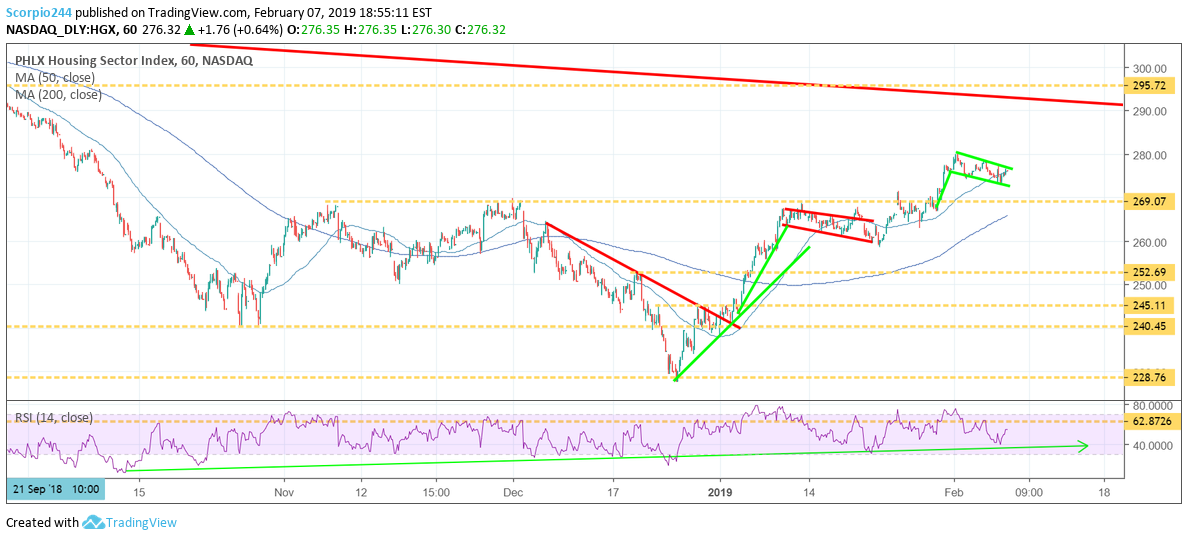
Housing (HGX)
Exhibit 4: A housing sector that looks like it is ready to break out.
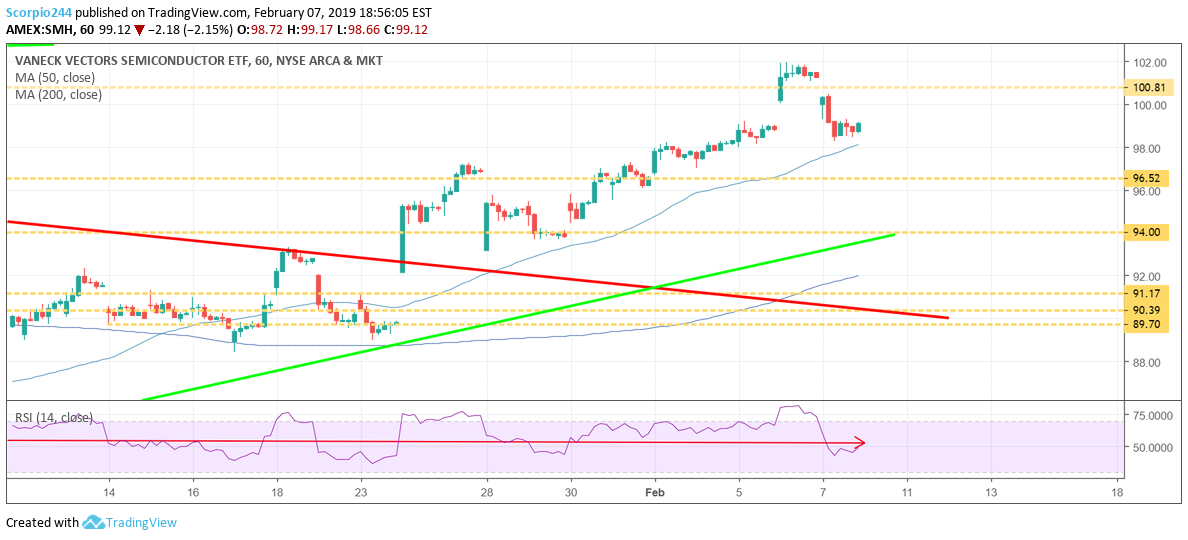
Semis (NYSE:SMH)
The semiconductor sector filled the gap and stopped falling.
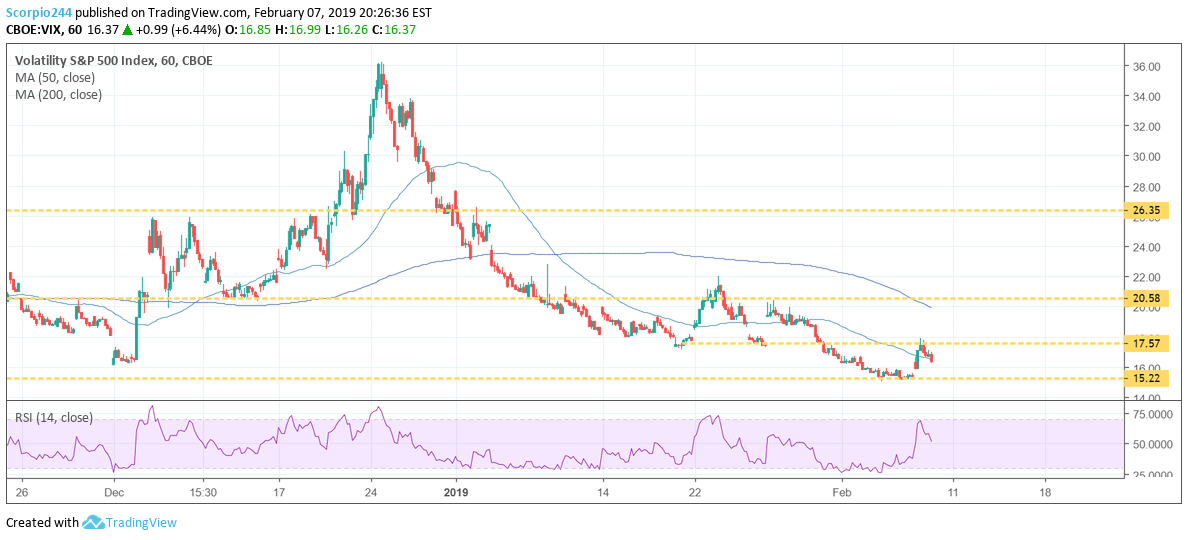
VIX
Even the VIX failed at resistance exactly where it should at roughly 17.50.
Mostly the significant parts of the market held precisely were they were supposed too. So no, I don’t think the sell-off continues. Sorry.
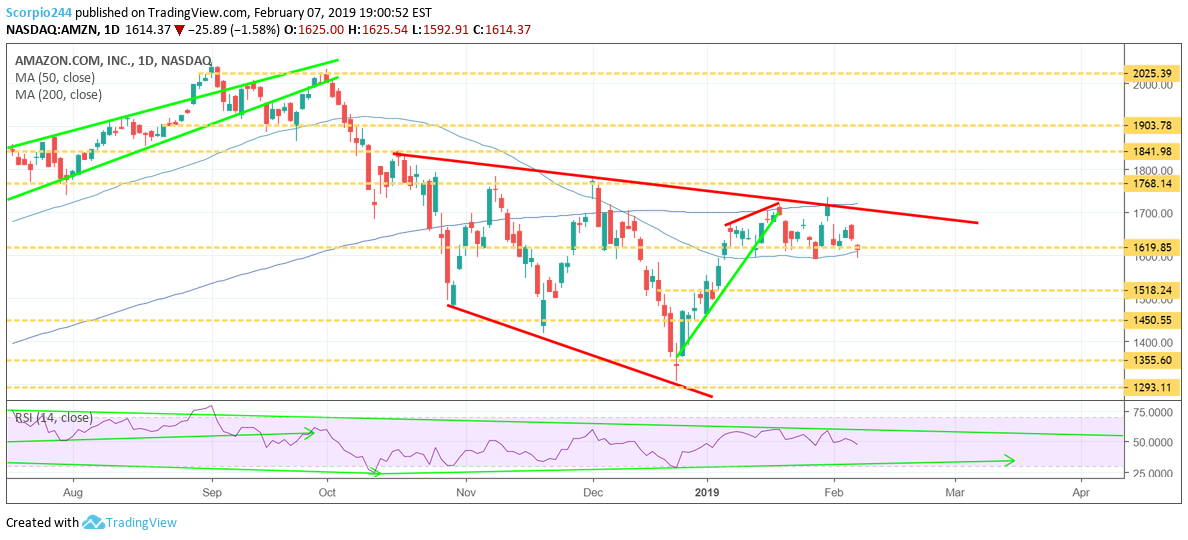
Amazon (NASDAQ:AMZN)
Amazon now that is a different story. I do think Amazon will continue to fall, and no, I don’t think it will weigh on the broader market. It fell below $1,620 today, and the RSI is just going the wrong way. I still think it falls to roughly $1,518. Here is a free story I wrote on the stock today and why the stock has a valuation problem as well. Amazon’s Stock Is Facing Even Steeper Declines
Nvidia (NASDAQ:NVDA)
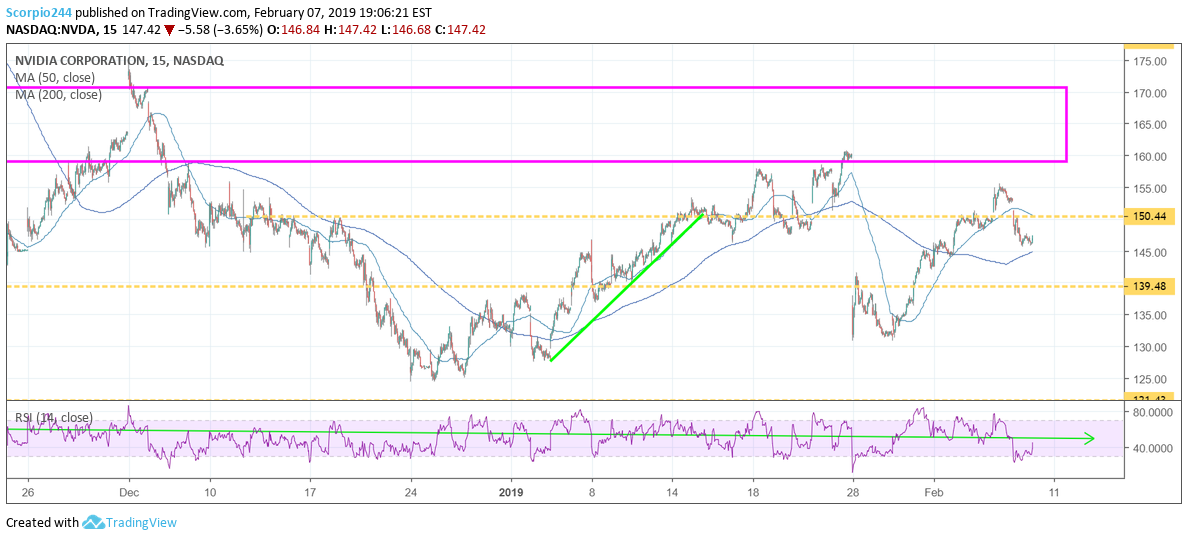
Nvidia is another stock that I think can fall. The company reports results next week, and I’d be anxious about the guidance the company provides for the second quarter. Has any chip met revenue estimates for the upcoming quarters? So there is plenty to worry about here, and I can’t see the stock rallying into that. The gap is filled, and that means the stock goes back to its earlier trend –lower.
Qualcomm (NASDAQ:QCOM)
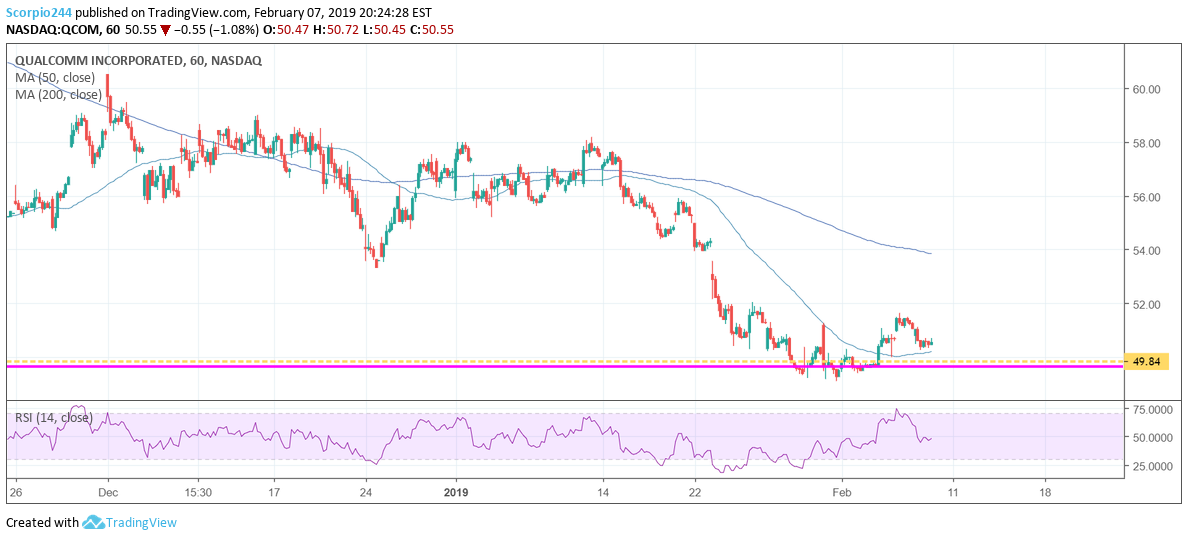
Qualcomm continues to act well and holds support around $50. I think this one can head back towards $54.
Netflix (NASDAQ:NFLX)
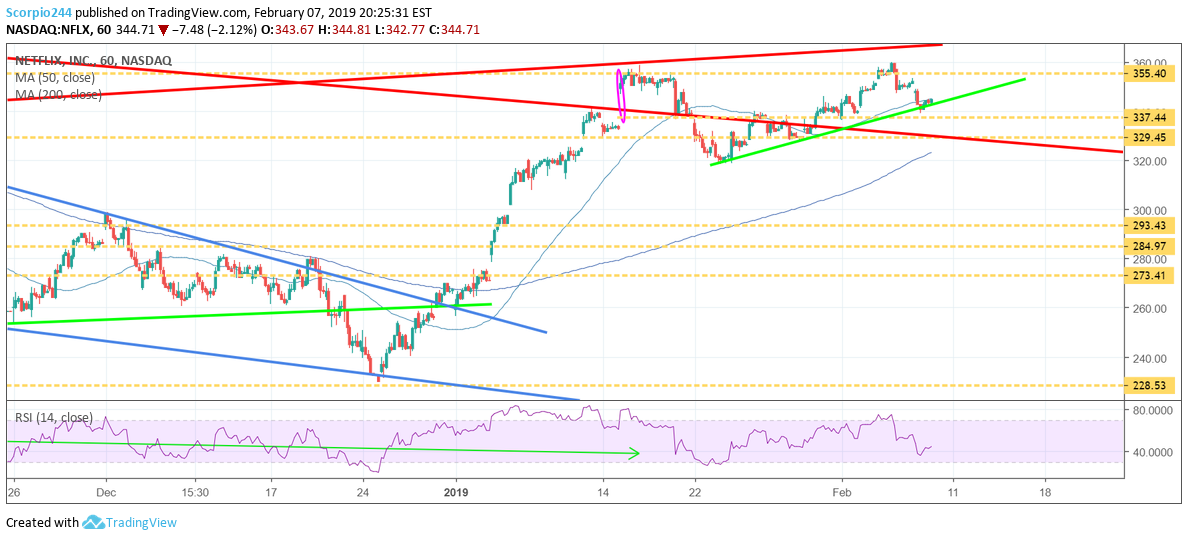
Netflix continues its trend higher, but the big level of resistance still lurks in the $355 to $360 zone.
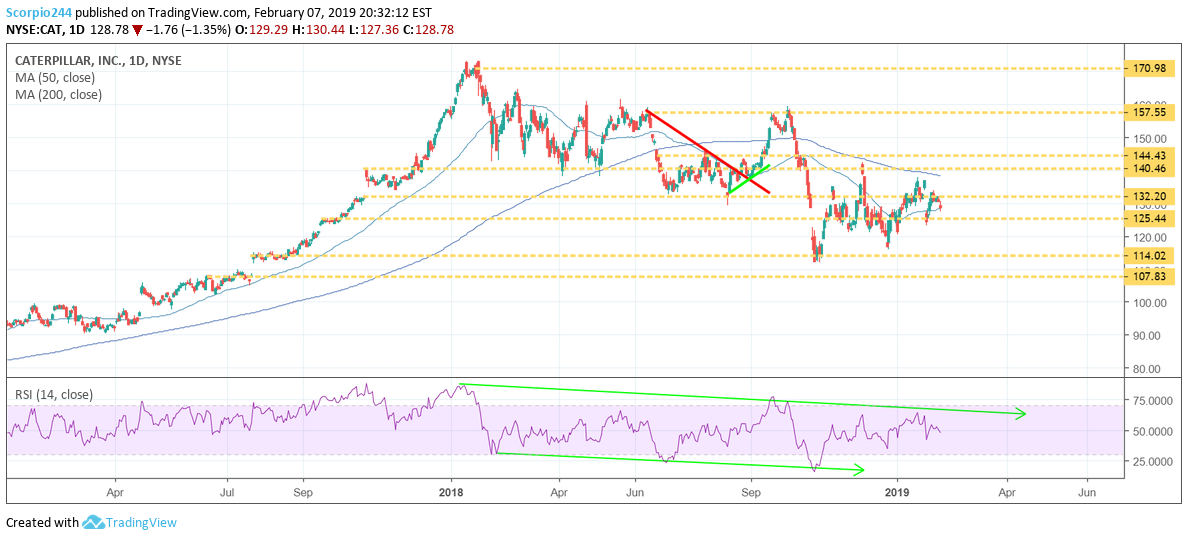
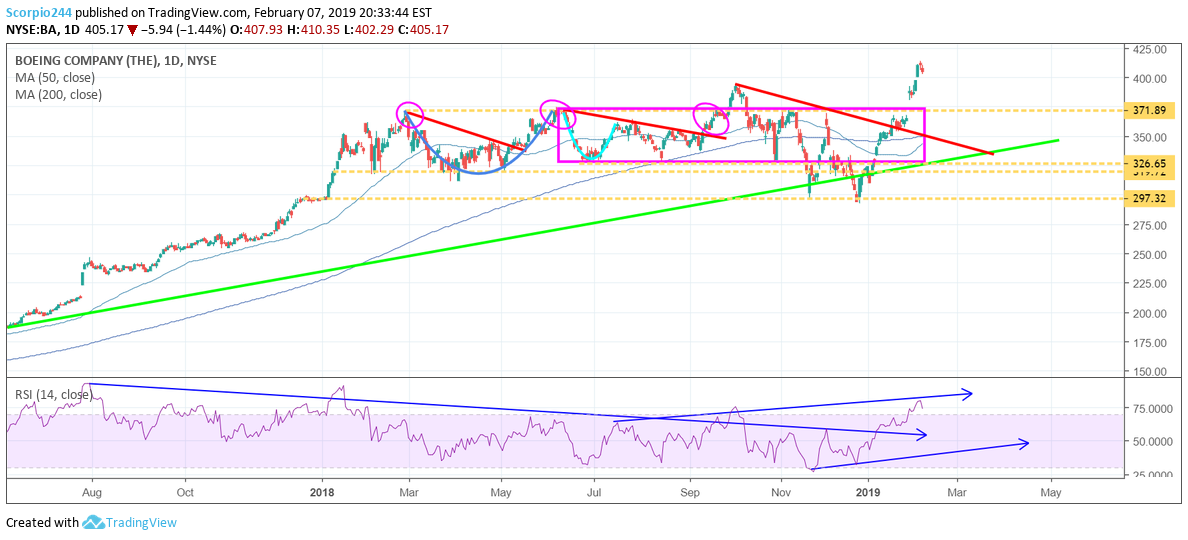
As for trade war concerns, those big “trade war” proxies like Caterpillar (NYSE:CAT) and Boeing (NYSE:BA) acted pretty well today. In fact, Cat was only down 1.35%. A few weeks back it would have been 3,4, or 5%.
Caterpillar (NYSE:CAT)
Separately, the chart for Cat is a mess, and that RSI looks downright ugly, and that would suggest lower prices are on the horizon. Maybe to $114.
Boeing (NYSE:BA)
Boeing fell 1.5%, a couple of weeks ago this stock would have been hammered.
NXP (NASDAQ:NXPI)
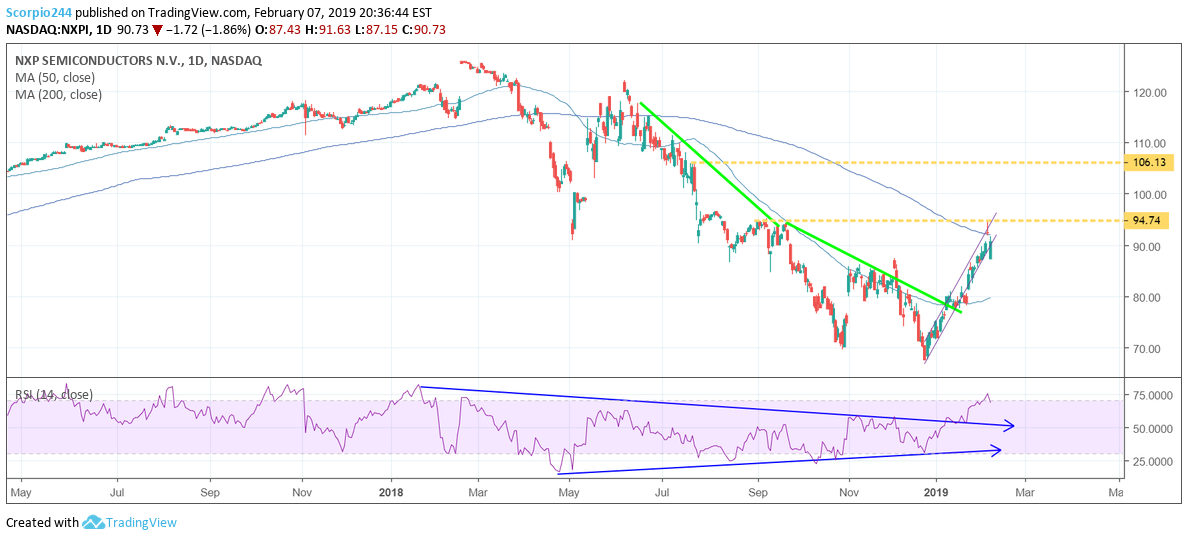
NXPI told you on their conference call today how bad China was and how the trade war was hurting business.
I think we’re in a very unusual environment where the U.S. is okay. Europe is basically okay, maybe not quite as robust as it was in Q3, but China is just kind of locked down, it’s in a quagmire. Our distribution partners’ customers are not placing orders and not taking inventory because of their uncertainty about what’s going to happen in the trade war.
So I ask, if investors are so worried about the trade war why did this stock come all the way back from being down more than $5 at the open? It makes a lot of sense, right?!
The trend in the RSI has changed dramatically for this stock and suggests higher prices on the way.
Micron (NASDAQ:MU)
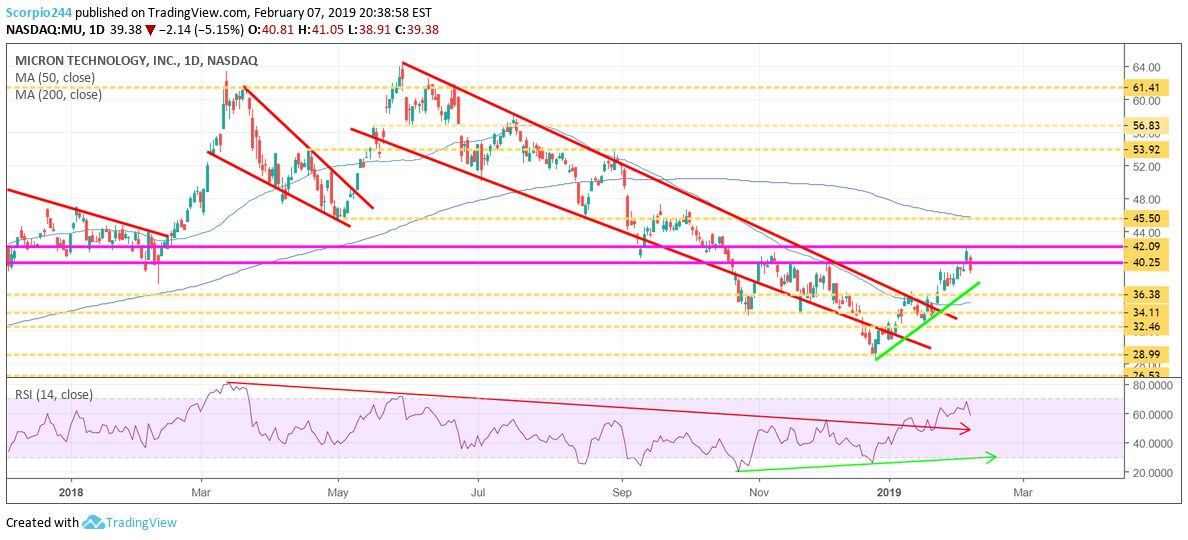
Micron is in a similar camp, and again I still see this one heading higher. It tested $42 yesterday, but the uptrend is still strong.
General Electric Company (NYSE:GE)
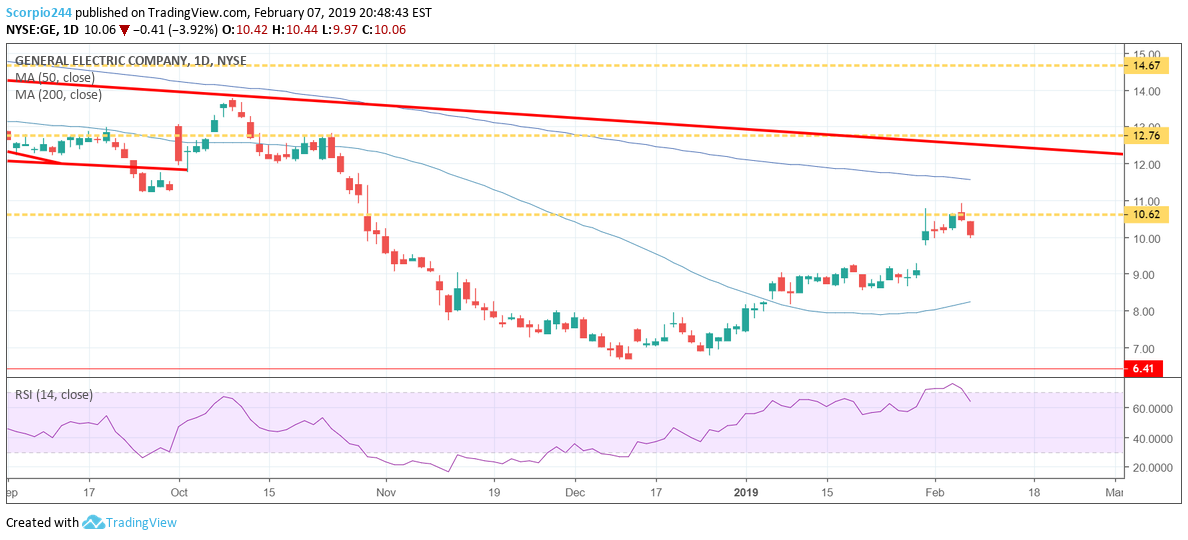
I still GE heading back to $9.
Let’s see what the morning brings.

