CME Group (NASDAQ:CME)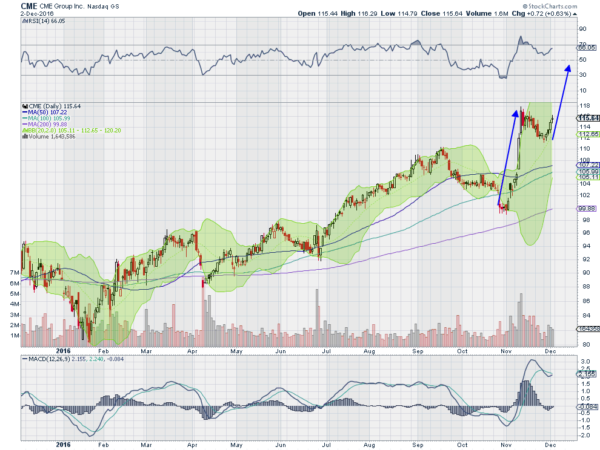
CME Group, CME, has moved higher in 2016 off of a low in January. In September it stalled and pulled back to 100 before resuming the move higher, but at a steep rate. That found resistance and pulled back in a bull flag.
It broke that flag last week to the upside and is now approaching the prior high. The RSI is bullish and has reset from an overbought condition, while the MACD arrested its fall and is reversing higher. Look for continuation to participate to the upside…..
Costco (NASDAQ:COST)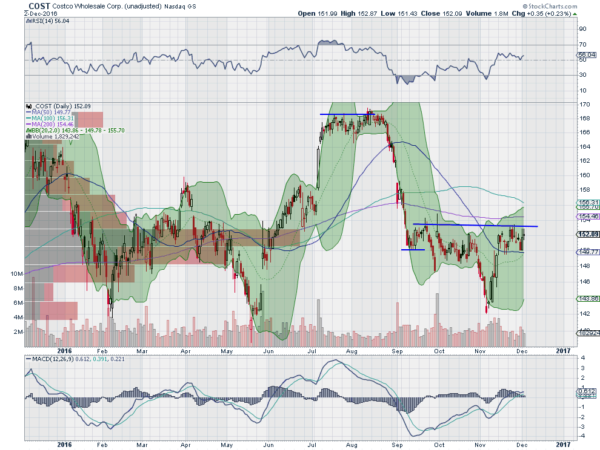
Costco, COST, peaked in August just under 170 and fell back sharply, losing over 105 of its market cap in 2 weeks. It consolidated there for nearly 2 months before another dip lower at the start of November. The drop was short lived as it recovered in a “V” shape back to prior resistance.
The RSI is over the mid line teasing a move into the bullish zone, while the MACD is flat but positive after a move higher. Look for a break above resistance to participate higher…..
Jack In The Box Inc (NASDAQ:JACK)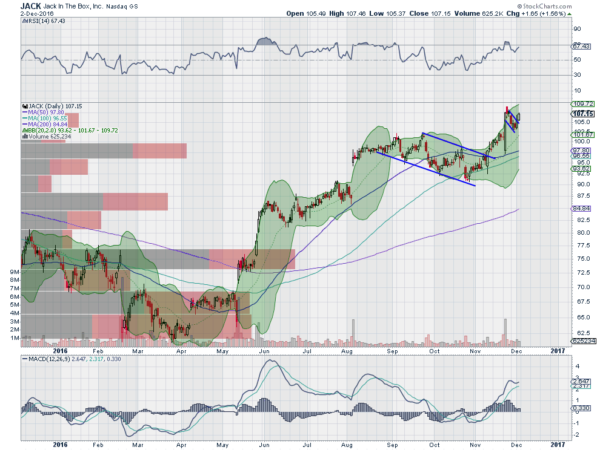
Jack in the Box, JACK, rose off of a low in April, plateauing in August. That led to a slight pullback and a bottom at the 50 day SMA in October. Since then though the stock has been moving higher again. The RSI is in the bullish zone and rising while the MACD is turning higher after avoiding a cross down. Look for a new high to participate to the upside…..
Louisiana-Pacific Corporation (NYSE:LPX)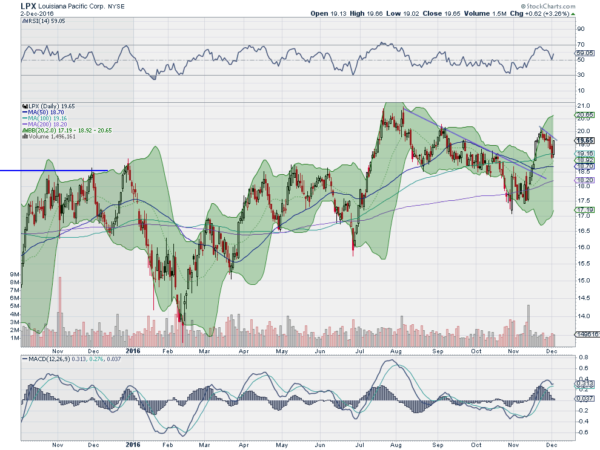
Louisiana-Pacific, LPX, started a run higher in late June that maxed out at 21 in mid-July. It made a double top there and started back lower in against falling trend resistance. This continued for nearly 4 months before it started back higher off of its 200 day SMA in mid-November. It stalled at the September top and has been pulling back in a bull flag since. Friday had a strong move higher to resistance, ending at the high.
The RSI is in the bullish zone and rising while the MACD is avoiding a cross down. Look for a push through resistance to participate in the next leg higher….
United Technologies (NYSE:UTX)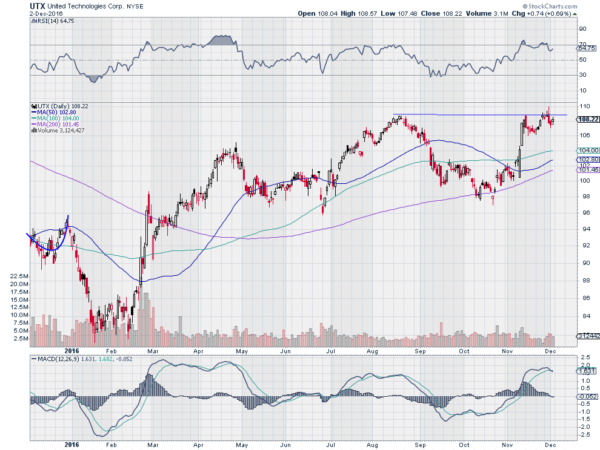
United Technologies, UTX, pulled back from a high in August to its 200 day SMA in October, a loss of 10% of its market cap. It held there for a while before a bounce that recovered most of that 10% in just 2 days. It stalled at the prior high and made a shallow pullback before rising to retest the top. The RSI is in the bullish zone and rising but the MACD is resetting over. Look for a push over resistance to participate to the upside…..
After reviewing over 1,000 charts, I have found some good setups for the week. These were selected and should be viewed in the context of the broad Market Macro picture reviewed Friday which heading into the last month of the year sees the equity markets retrenching from their post-election moves, with shallow pullbacks at this point.
Elsewhere look for Gold to continue in its downtrend while Crude Oil moves higher. The US Dollar Index continues to mark time, moving sideways, while US Treasuries are biased to continue lower. The Shanghai Composite is on a trend higher that looks to continue while Emerging Markets consolidate at resistance with a bias to the downside.
Volatility looks to remain low keeping the bias higher for the equity index ETF’s SPDR S&P 500 (NYSE:SPY), iShares Russell 2000 (NYSE:IWM) and PowerShares QQQ Trust Series 1 (NASDAQ:QQQ). Their charts are mixed again, with the longer timeframe better for all 3, but the shorter timeframe showing weakness. All 3 ended the week with indecision candles though so the retrenchment may end soon. Use this information as you prepare for the coming week and trad’em well.
DISCLAIMER: The information in this blog post represents my own opinions and does not contain a recommendation for any particular security or investment. I or my affiliates may hold positions or other interests in securities mentioned in the Blog, please see my Disclaimer page for my full disclaimer.
