Aetna Ticker: $AET, 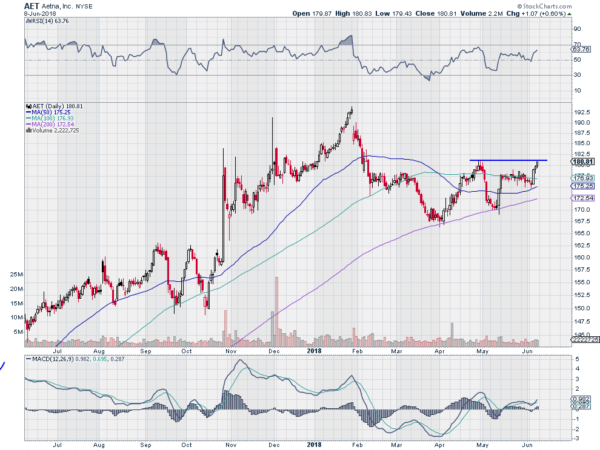
Aetna, $AET, accelerated to the upside in October and then slowed the pace but trended higher until a top in January. It pulled back in 2 steps to the 200 day SMA where it found support at the beginning of April. A bounce topped later that month and then it fell back to the 200 day SMA again. It has moved back higher recently, to the prior top at the end of the week. The RSI is rising and bullish with the MACD positive and moving up. Look for a push through to a higher high to participate…..
Bristol-Myers Squibb, Ticker: $BMY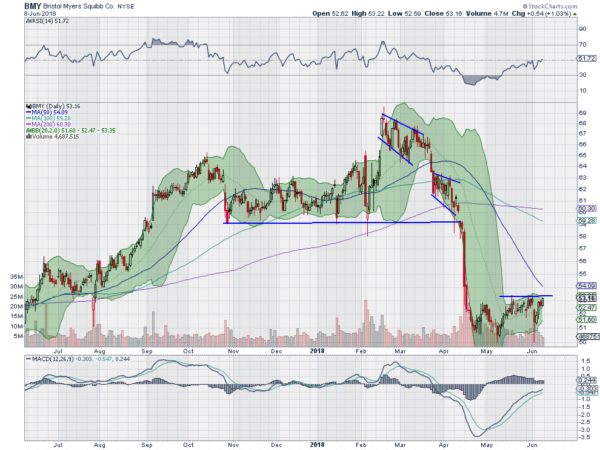
Bristol-Myers Squibb, $BMY, fell from a top in February and accelerated when it broke support and the 200 day SMA in April. It started to stabilize as it turned to May and has now identified resistance above. The RSI is rising at the mid line with the MACD about to turn positive. Look for a push over resistance to participate…..
Graco, Ticker: $GGG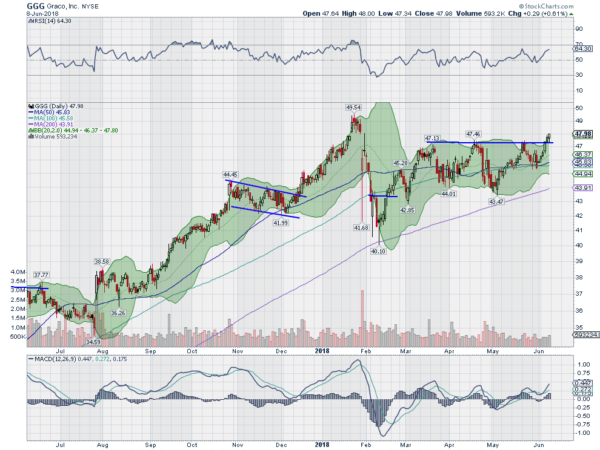
Graco, $GGG, started higher in August last year, consolidating for a month in November and then rising gain to a top in January. It fell fast from there, and bounced off of the 200 day SMA. Since then it had stalled on moves higher 3 times before breaking through to a higher high at the end of last week. The RSI is rising in the bullish zone with the MACD moving up and positive. Look for continuation to participate…..
3M, Ticker: $MMM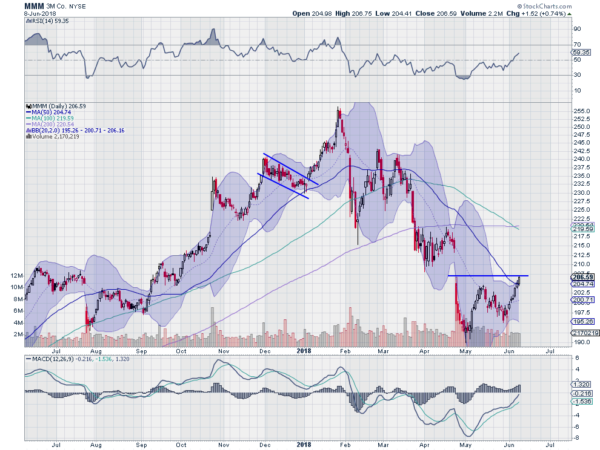
3M, $MMM, peaked at the end of January and then quickly fell back to its 200 day SMA. It bounced from there to a lower high and consolidated for a month, but then fell back again, this time to a lower low in April. It consolidated again, under the 200 day SMA, and then resumed the path lower to a bottom in May. That is when it started to turn. Following another bounce it pulled back to a higher low, and then reversed and is now making a higher high. The RSI is rising toward the bullish zone with the MACD about to go positive. Look for a break into the gap to participate…..
Raytheon, Ticker: $RTN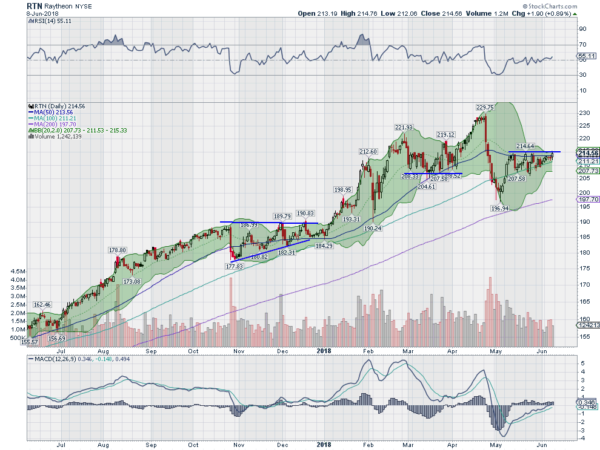
Raytheon, $RTN, rose out of a consolidation at the end of 2017 to a top in April. It pulled back hard over less than two weeks, breaking prior support, and then bottomed in early May. The reversal from there rose back over prior support and has been consolidating under resistance since. The RSI is rising toward the bullish zone while the MACD has crossed to positive. Look for a push over resistance to participate…..
Up Next: Bonus Idea
After reviewing over 1,000 charts, I have found some good setups for the week. These were selected and should be viewed in the context of the broad Market Macro picture reviewed Friday which heading into the FOMC June meeting and monthly Options Expiration sees the equity markets looking strong.
Elsewhere look for Gold to continue to consolidation around 1300 while Crude Oil consolidates after pulling back. The US Dollar Index looks to continue lower while US Treasuries are biased lower in broad consolidation. The Shanghai Composite is consolidating at 52 week lows and Emerging Markets remain in a pullback in the uptrend.
Volatility looks to remain very low keeping the bias higher for the equity index ETF’s SPY, IWM and QQQ. Their charts show the IWM the strongest and leading on the longer timeframe with the SPY and QQQ building strength as well. Use this information as you prepare for the coming week and trad’em well.
The information in this blog post represents my own opinions and does not contain a recommendation for any particular security or investment. I or my affiliates may hold positions or other interests in securities mentioned in the Blog, please see my Disclaimer page for my full disclaimer.
