Here is your Bonus Idea with links to the full Top Ten:
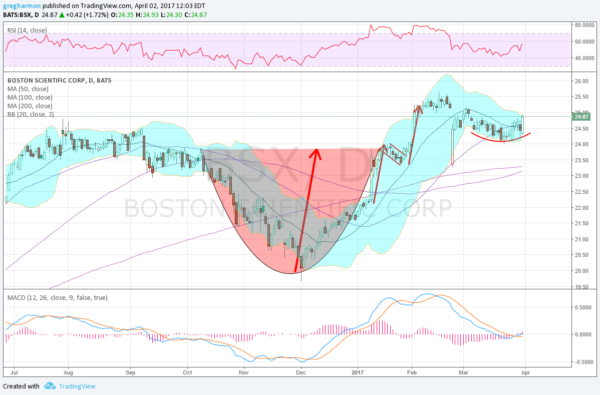
Boston Scientific (NYSE:BSX), moved higher out of a Cup and Handle pattern in late January, stalling well short of the price objective. The slow shallow pullback met the 50 day SMA in March and started to roll back higher last week. The Cup and Handle target to 27.75 still stands. The bullish engulfing candle Friday is a show of strength and suggest more upside to come, as does the tight Bollinger Bands®.
Momentum is turning back higher as well. The RSI is turning up just like price does. The MACD is crossing up, its own buy signal, at the zero line. There is a natural support level to trade against at 24. Below that support shows up at 23.40 and below that you really do not need to be involved. Resistance stands at 25.10 and 25.50. You then need to look back 2005 to find it at 26.60 and 29, with 31 and 34 from 2004. The peak was 46.10 in 2004. So this consolidative pullback around 25 has been at a 50% retracement of the full move lower. Short interest is low at 1.2% and company is expected to report earnings next on April 27th.
The April options chain shows large open interest at the 25 call strike and the half the size at the 23 put strike. April options suggest a 75 cent move in the stock price over the next 3 weeks. The May options, which encompass the earnings report, also show the biggest open interest at the 25 call strike. But they also have big open interest above that at 26 and 28. On the put side the open interest is spread from 23 to 25. At-the-money straddles in may suggest a $1.65 move in the stock by expiry.
Boston Scientific
Trade Idea 1: Buy the stock now (over 24.75) with a stop at 24.
Trade Idea 2: Buy the stock now (over 24.75) and add a May 24/23 Put Spread (29 cents) for protection through earnings and sell an August 28 Covered Call (36 cents) to fund it.
Trade Idea 3: Buy the April 25 Call (34 cents).
Trade Idea 4: Buy the May 25/26 Call Spread (47 cents) and sell the May 23 Put (22 cents).
Trade Idea 5: Buy the April/May 25 Call Calendar (52 cents).
After reviewing over 1,000 charts, I have found some good setups for the week. These were selected and should be viewed in the context of the broad Market Macro picture reviewed Friday which with the first Quarter in the books, saw equity markets trying to brush off the recent pullback and start higher.
Elsewhere look for Gold to consolidate in the short run while Crude Oil continues higher. The US Dollar Index looks better to the upside for the coming week while US Treasuries remain in their consolidation range. The Shanghai Composite looks to continue to drift higher, trying to separate with long term levels and Emerging Markets continue to move higher.
Volatility looks to remain at abnormally low levels keeping the wind at the backs of the equity index ETF’s SPY (NYSE:SPY), iShares Russell 2000 (NYSE:IWM) and PowerShares QQQ Trust Series 1 (NASDAQ:QQQ). Their charts look constructive on the short term, and bullish for the QQQ, while longer term in consolidation. Perhaps the short term will spill over into the longer term. Use this information as you prepare for the coming week and trad’em well.
The information in this blog post represents my own opinions and does not contain a recommendation for any particular security or investment. I or my affiliates may hold positions or other interests in securities mentioned in the Blog, please see my Disclaimer page for my full disclaimer.
