We often get questions from readers about the criteria we use when considering positions in a market. Because of that, we decided to release our best insights here.
The reason we mention 2017 is that market conditions tend to change over time, and so do our criteria. The investment tips in this article are up-to-date, in-line with what we believe are actual market conditions. To illustrate that, we have included recent charts and data points.
Tip #1: Remain objective
It is extremely hard to remain objective when looking at markets and charts. We tend to see what we want to see (read: hope to see). That is normal human behavior, certainly if one holds positions in a market.
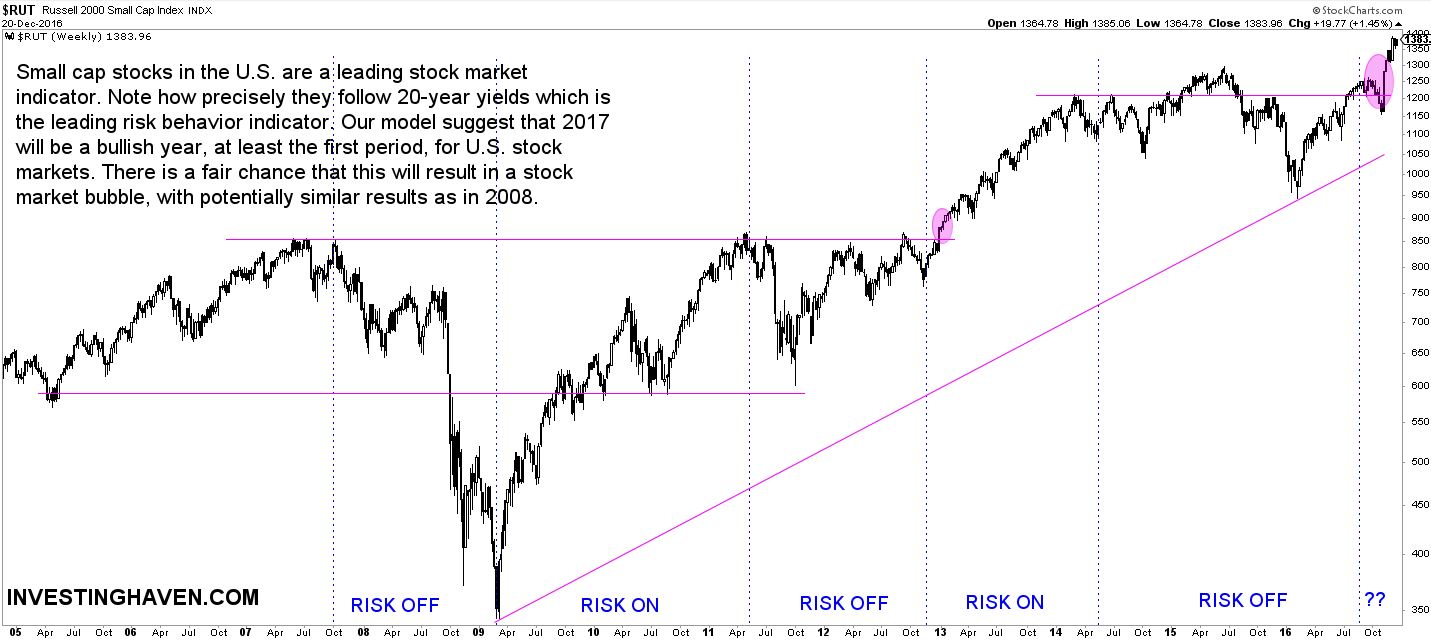
The only way to neutralize your personal view is to have a quantifiable set of criteria or a methodology under which you operate. After many years, making many mistakes, we defined a methodology with a structured set of rules to read markets. Specifically, we have identified two leading indicators for all markets: 10-Year Yields and small cap stocks (Russell 2000). They serve as the basis to identify risk on / risk off.
Next to that, we identify the behavior of 5 leading markets (gold, dollar, copper, crude oil, Japanese yen). Both groups of elements provide a sound and objective framework with which to identify primary trends in markets, which is the basis for trends in all other markets and stocks.
That results in structured charts. Below is an example of a structured chart—see annotations—of one of our two leading indicators.

Tip #2: Do not rely on news; use charts
We are aware that not everyone agrees with the statement that “news is noise”, because most investors tend to rely on news. That is because we are taught to listen to news, and value news. Moreover, we work with news in our daily lives.
Markets, however, work differently. News is for entertainment purposes at best when it comes to investing, for sure 95% of news. There is only a very small portion of news that is really relevant.
The whole point is that market action is the only thing that counts. The reaction of investors to news is reflected in the chart; news in and on its own has no value. Price behavior, as well as trading volume, should be considered the news. All the rest is noise.
Analyzing a chart yields much more insight than most investors can imagine. Knowing how exactly to read a chart is the key challenge. It took us many years to come to the structured chart which we included in the previous point. That is the ultimate goal though.
The internet is full of news, and doom-and-gloom news is very popular nowadays. We mentioned in a recent article that many analysts like to write about a stock market crash or a stock market bubble, a perfect case of how you can get scared out of your positions. Do not listen to those storytellers. Instead, create your own story which you read in your charts.
Tip #3: Less than 20 percent of price points are valuable
When reading charts, investors should realize that the majority of price points do not carry valuable information. Only a minority of 10- to 20-percent of price points is valuable. Those price points enable you to identify patterns. A chart pattern is certainly not technical analysis, it simply shows one or several trends.
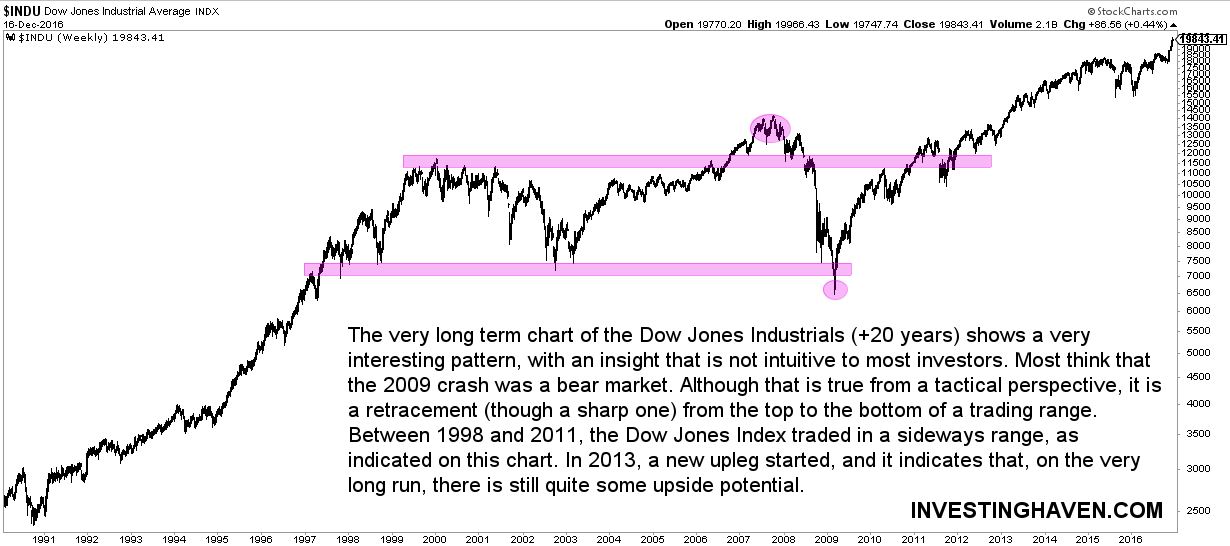
Let’s take our recently published Dow Jones 20-year chart as an example. As seen on the chart below, the long-term trading range as well as the uplegs before and after that range, are of importance. Those chart patterns can be identified with a minority of price points.
Looking back very often to the same chart is not valuable. Identifying valuable price points, and monitoring what happens around those points is what investors should do.

Another actual example to illustrate this point is our long term US dollar chart, released recently. We have annotated two major trendlines on this chart. Those patterns are set with a minority of price points, and we only monitor a limited set of prices day-to-day.
Tip #4: Be careful with market correlations and ratios
Many analysts try to make a point or a forecast by looking at market correlations. A very well known market correlation is the US dollar vs gold, inversely correlated. Another one is crude oil vs stock markets, positively correlated.
Market correlations can work, but they tend to be misleading as they do not work during some critical times. Case in point: crude oil has a positive correlation with stock markets during “normal” times, but not during times of panic. Mr. Market constantly tries to mislead investors. Unfortunately, it is during those “abnormal” times that the biggest losses are made. The accumulated wealth during “normal” times can be very quickly lost during “abnormal” times.
Similarly, ratios are often used by analysts to make a forecast. They, as well, can be very misleading. Case in point: Why It Is Dangerous To Rely On Ratios. Investors should look at ratios as an additional source of information, not a leading indicator. Tip #1, outlined above, should always be leading, and leading indicators should be respected.
Tip #5: Only 20 percent of investors win big
Pareto’s rule is present everywhere, also in the investment world. Unfortunately, only a minority of investors is successful. Less than 20 percent of investors win big money, the majority are at breakeven or negative levels.
That is an important insight, more so than ever in 2017. Why? Because there is a lot of competition since the entry barriers are very low nowadays.
In 2017, more than ever, the investment world will have machine trading (high frequency trading), masses of electronic data, trading tools, and the likes. It is mandatory to stick to a set of rules when making investment decisions, i.e. entering and exiting positions.
