
Here are my top insights from the recently released JPMorgan (NYSE:JPM) Guide to the Markets for the 4th quarter of 2016.
Some very interesting observations can be made from the charts in this report.
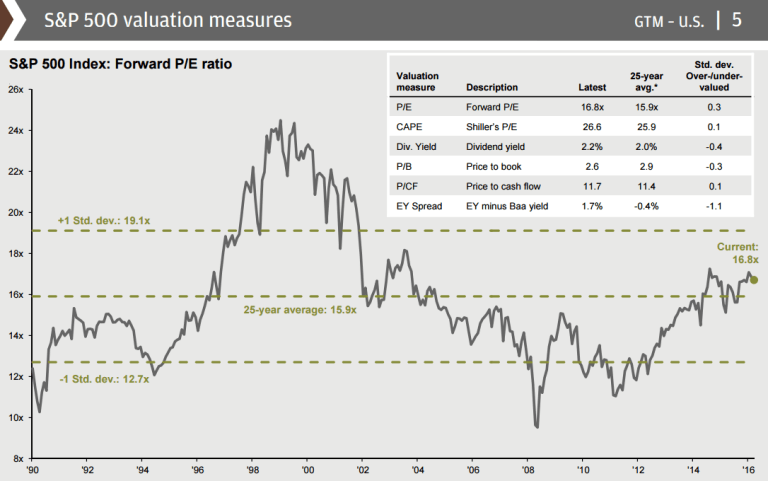
1. The S&P 500 is a Little Bit Overvalued Right Now
JPMorgan Guide To The Markets
Check out the chart above. Compared to its 25-year long term average, the S&P 500 looks to be just slightly overvalued in terms of Forward P/E, Shiller’s P/E, and P/CF.
2. Energy Firms are Almost Out of the Red
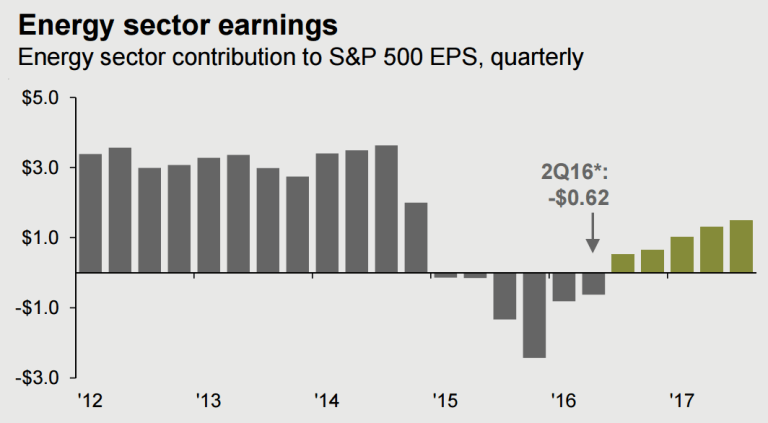
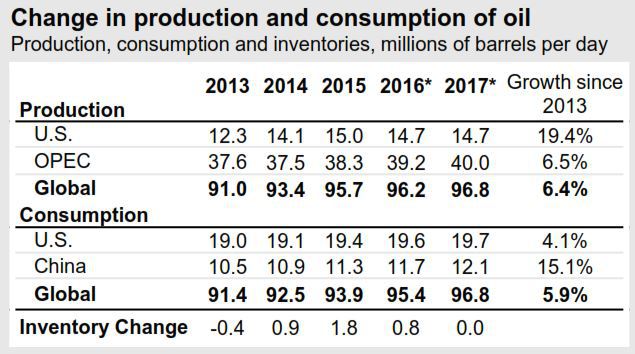
It looks like the tide is finally turning for energy stocks, with firms rebalancing their budgets and figuring out how to make money with lower oil prices. The fact that oil is now hovering around $50/barrel is sure to help as well. And after 3 years of overproduction, the EIA is projecting stability next year, with 96.8 million barrels per day of oil produced and 96.8 million barrels per day consumed in 2017.
3. Tech & Telecom Stocks Look Relatively Cheap, Energy & Utilities Look Expensive
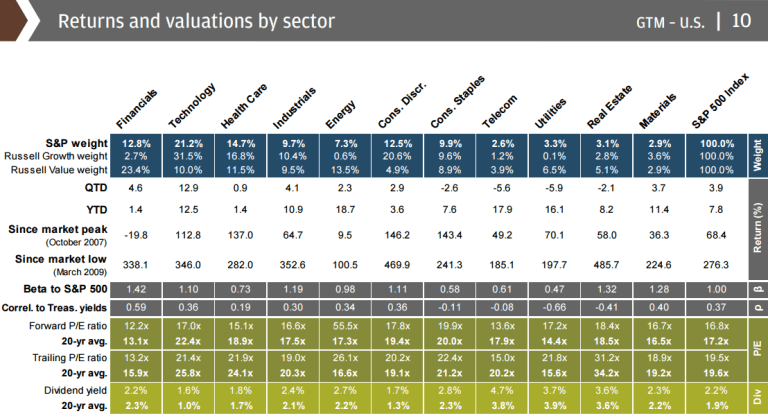
Comparing trailing and forward P/E ratios to their long-term historical averages, technology stocks and telecom stocks appear to be the most undervalued… and energy and utilities look way overvalued.
4. We’re in the 4th Longest Bull Market in History… But with the Slowest Financial Recovery
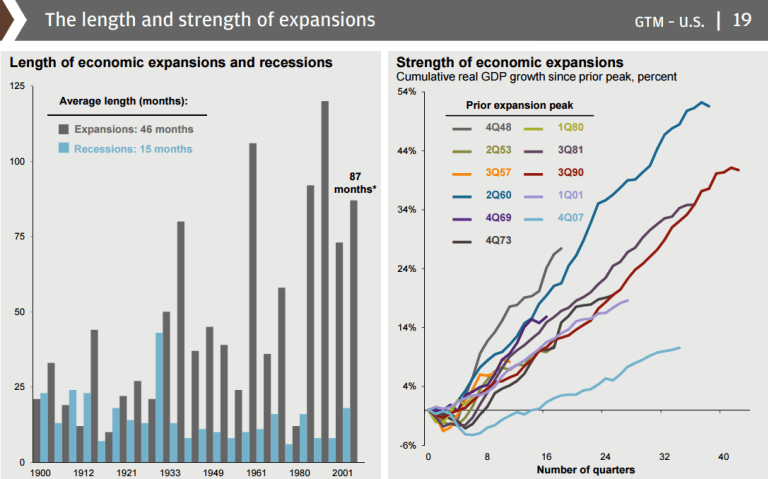
At 87 months, this is the 4th longest bull market in history. And yet the economic recovery has been by far the slowest.
5. People Hate Congress… But Have Been Warming Up to Obama
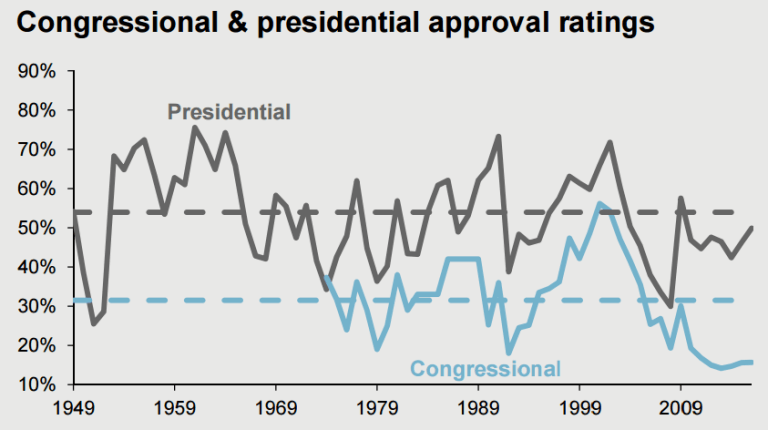
Finally, with such a slow economic recovery and the brutal bipartisanship we’re seeing out of Washington, Americans’ approve of Congress has never been lower. And while Obama’s approval rating is still below average, he’s seen a steady increase over the past year or so.