Over the weekend, the Denver Broncos beat the New England Patriots in the AFC Championship. Popular football analysts had – across the board, it seemed – believed the Patriots were a “shoe-in.” They were wrong. Peyton Manning could still throw deep passes to score touchdowns. And Denver’s defense rattled Tom Brady on nearly every Patriot possession.
In a similar vein, an overwhelming majority of analysts believed that the ending of QE3 in December of 2014 and the 0.25% rate hike in December of 2015 would not adversely affect risk assets. They were wrong. Fed monetary policy involves so much more than short-term overnight lending rates; policy affects corporate bonds, foreign bonds, exchange rates and risk preferences. Indeed, since the end of 2014, the dollar has rocketed 20%, the S&P 500 has lost roughly 7% and junk bond yields are the highest that they’ve been since 2009.
In truth, many analysts and many investors have held onto a variety of misunderstandings about the current investing environment. Here are five of them:
1. Lower Oil Prices Are Great For The Economy. Scores of analysts have steadfastly maintained that lower oil prices are a net benefit for the economy. They consistently talk up how consumers are free to spend more because they have more money in their pockets.
However, the analysis misses the mark on several fronts. If you saved $50 at the Shell (L:RDSa) station last month, you may have decided to spend all of those dollars at Bed, Bath and Beyond (O:BBBY). Yet you did not spend additional dollars to benefit the overall economy; rather, you spent the same amount, but you spent it on pillowcases instead of gasoline. In the same vein, even if you spend all of the $50 from your gas pump savings, producers would likely cut back on their spending by a similar amount. In other words, the consumer who has $50 more per month to spend would be offset by the producer who has $50 per month less to spend. That’s a net wash.
In fact, assuming that lower oil prices represent a net wash for the economy may be too generous. The primary way that producers survive the loss of revenue is to lay off workers. Through October of 2015, roughly 250,000 employees around the world (100,000 in the U.S.) have already lost their employment. New layoffs have been announced regularly since last October. With displaced workers from the high-paying oil and gas sector more likely to find their way into the lower-paying service sector, those folks have less money from their wages to spend than they did before.
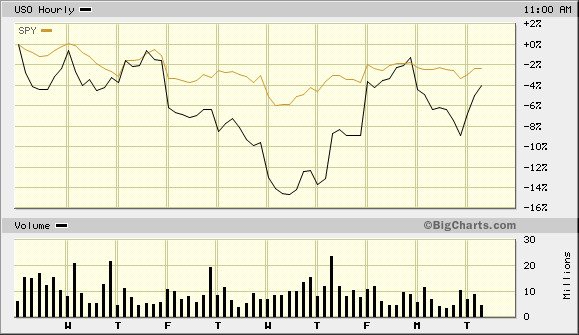
Consumption, then, may be hampered by persistently low oil prices. In fact, the correlation between oil prices and stocks soars during recessionary pressure. The correlation spiked to more than 0.8 during the financial collapse in 2008. Similarly, the 50-day relationship between stock prices and oil prices today is at 0.9. The United States Oil Fund (N:USO) and the S&P 500 SPDR Trust N:SPY) are moving in the same direction almost every single trading session.
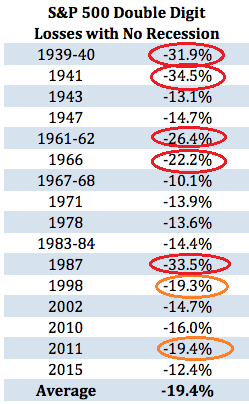
2. No Recession, No Bear Market. The origins of some myths are difficult to pinpoint. When it comes to double-digit percentage declines with the dubious distinction as stock bear markets, however, there have been five non-recession occasions dating back to 1939-1940. There have also been two borderline bears – the Asian Currency Crisis in 1998 and the Euro-Zone Debt Crisis in 2011 – where massive central bank bailouts rescued risk assets from worldwide contagion. In other words, 44% of non-recession corrections in the S&P 500 had bearish implications.
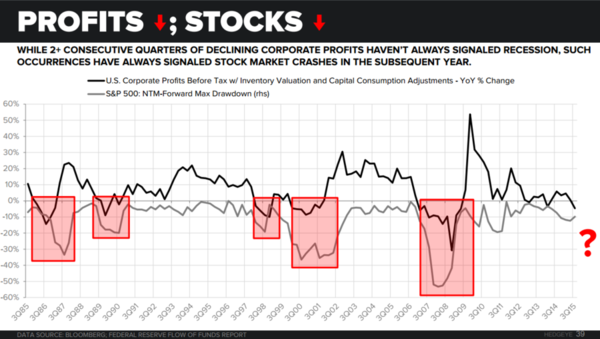
There are a number of additional issues with the “no recession, no bear market” discussion. For one thing, the average U.S. large-cap, mid-cap and small-cap has already fallen far more than the requisite 20%. Using the Dow or the S&P 500 as the only proxy for stock performance in the United States is myopic. Second, we already have a profit recession with three consecutive quarters of year-over-year declines in corporate profits as well as a manufacturing recession. Profit recessions themselves typically result in sharp (20%-plus) losses for the S&P 500.
3. Manufacturing Does Not Matter. The U.S. is a service-oriented economy. Approximately two-thirds of gross domestic product (GDP) is attributable to consumption, not production. And only 12% of GDP comes from manufacturer activity. Fair enough. But why do scores of analysts subsequently declare that manufacturing is irrelevant?
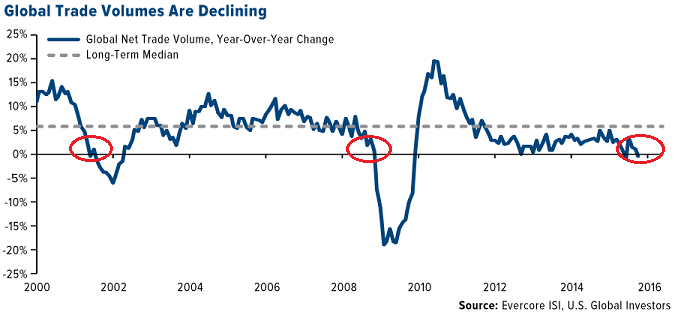
Let us consider additional facts about the impact of manufacturing. First, approximately half of corporate profits come from overseas, where “making stuff” has a super-sized impact on respective economies around the globe. When global trade volumes have faltered in the 21st century, U.S. recessions (and 50% stock market depreciation) were not far behind.
Secondly, according to Ruchir Sharma of Morgan Stanley, manufacturing accounts for 60% of S&P 500 profits. That’s a substantial role in financial markets, is it not? In fact, we can readily see this relationship between contraction in the Institute for Supply Management’s manufacturing sector and contraction in S&P 500 company profits.
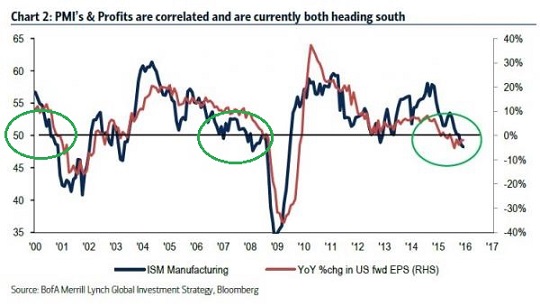
4. Steady Growth For S&P 500 Profits, Excluding Energy. According to FactSet, the blended earnings decline for Q4 2015 is -6.0%. This will mark the first time that the benchmark witnessed three consecutive quarters of year-over-year earnings declines since 2009.
Blame it all on the energy segment, right? The investment community has a short memory, as “ex-technology” had been floated in 2000-2001 and “ex-financials” had been touted in 2007-2008. Unfortunately, six of the 10 sectors are expected to report year-over-year declines in earnings, including energy, materials, industrials, technology, utilities and consumer staples. And for Q1, 2016, financials may make it seven out of 10.
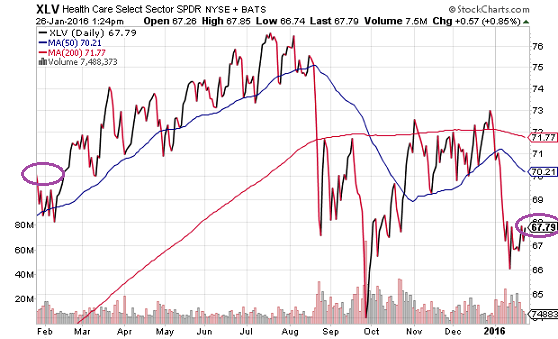
Can profit growth in segments like health care and telecom save the day? Well, if the financial markets are forward looking, fewer and fewer are willing to pay up for the growth sectors. Both the S&P 500 SPDR Select Sector Health Care Fund (N:XLV) and the iShares Telecom Fund (N:IYZ) are trading at lower prices today than they were trading 12 months earlier.
5. Stocks Are Cheap Now. With the S&P 500 trading near 1900, the Forward P/E Ratio is 15.1. The 35-Year Average? 13.0. With forward 12-month EPS estimates of $125.50, the index would need to fall to 1630 for stocks to be trading at an average multiple.
The S&P 500 hit an all-time nominal record of 2130 last May, where a 500-point price drop to 1630 would correspond to 23.5% bearish depreciation. The problem? For one thing, earnings estimates are likely to deteriorate further such that prices would have to fall even lower for the S&P 500 to trade at an average multiple of 13x. For another, bear markets are rarely kind enough to push prices down to average P/E ratios. On the contrary. Stock bears push prices to cheaper and cheaper levels such that price-to-book (P/B) ratios often move below 1.0.
Granted, the Federal Reserve may soon determine that the debt binges of foreign developed nations, emerging market countries, global corporations and U.S. energy companies threaten the stability of the global financial system… again. If so, the Fed may reverse course, looking to instill confidence through a fourth iteration of quantitative easing (QE4) or negative interest rates or a yet-to-be-determined arrow in its quiver. That said, the S&P 500 will not be a genuine bargain until and unless central banks allow prices to find their own floor.
Disclosure: Gary Gordon, MS, CFP is the president of Pacific Park Financial, Inc., a Registered Investment Adviser with the SEC. Gary Gordon, Pacific Park Financial, Inc, and/or its clients may hold positions in the ETFs, mutual funds, and/or any investment asset mentioned above. The commentary does not constitute individualized investment advice. The opinions offered herein are not personalized recommendations to buy, sell or hold securities. At times, issuers of exchange-traded products compensate Pacific Park Financial, Inc. or its subsidiaries for advertising at the ETF Expert web site. ETF Expert content is created independently of any advertising relationships.
