Are you trying to grind out a livable retirement on dividends alone? It’s possible, and it doesn’t require millions and millions already in the bank. (Even today, with interest rates in the tank.)
However, we must step outside the mainstream to achieve this. After all, why mess around with a standard $15,600 a year in retirement income when we can “supersize” that annual yield haul up to $108,000?
The “standard” $15.6K is what we get listening to mainstream financial advisors and pundits, and buying the vanilla ETFs that they recommend. The latter $108K is what we can achieve with a little bit of original thinking.
And, better yet, we can bank these bigger dividends while owning high-quality stocks. (The types that survive pullbacks like these, and thrive afterwards.)
Thanks to this near-correction in the S&P 500, the blue-chip index now yields a big, fat… 1.8%. And a bundle of diversified high-quality bonds like those we’ll find in the iShares Core U.S. Aggregate Bond ETF (NYSE:AGG) yields a paltry 1.2%. That means even if we put a million dollars to work in a 60/40 portfolio (60% S&P 500 tracker, 40% AGG), we generate a mere $15,600 in dividends and interest payments.
Many Social Security payments amount to more than this! It wasn’t always this way. Decades ago, we could earn not just safe, but substantial, long-term income by relying on fixed income from even the highest-quality of bonds. Treasuries, AAA corporates, trusted developed-market sovereigns helped whole generations sleep well at night.
Treasuries Used to Pay—Not Anymore
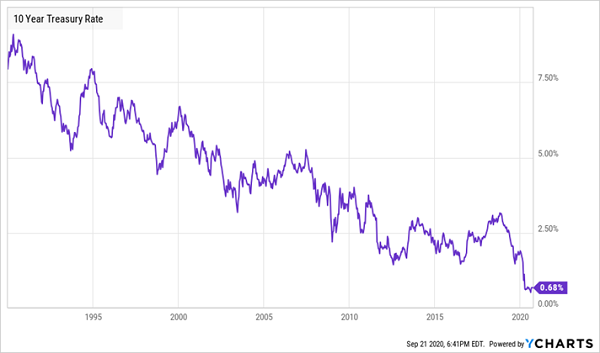
There’s no relief on the horizon, either. The Federal Reserve recently indicated that it was content to leave rates near zero through the end of 2023. Financial advisors are only now even starting to come around to the idea that their age-old recommendations will leave their clients high and dry in retirement.
Just how bad is it? If you rely on a basic 60/40 portfolio starting at today’s yields, you’ll be underwater paying for even the most bare-bones lifestyle.
Consider this table below, which shows the monthly income from a $1 million nest egg invested 60% in an S&P 500 tracker and 40% in AGG, as well as the average Social Security paycheck, stacked up against a list of basic retirement costs compiled by NerdWallet.
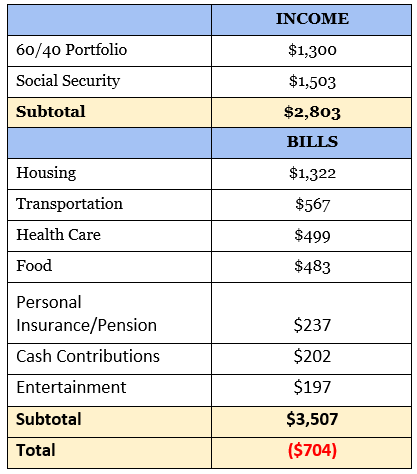
That’s right. We’re looking at a $704/month deficit, and even if you booted every last entertainment cost, we’d still be more than $500 in the hole every month. What kind of a world do we live in when a million dollars isn’t enough to retire on?
Traditional income strategies just won’t cut it anymore. We need higher yields, not to mention payouts that grow over time, to actually retire on dividends. Here are a few outside-the-mainstream ideas to consider:
Liberty All-Star Equity
Type: Large-Cap Stock
Distribution Yield: 10.8%
Close your eyes and imagine what would happen if the S&P 500 yielded more than 10%. That image you have in your head probably looks something like Liberty All Star Equity Closed Fund (NYSE:USA)
This actively managed closed-end fund (CEF), which has been around since 1986, uses a team of specialists to wring performance and yield out of the large-cap space. Specifically, its funds are equally distributed across five managers (three value, two growth), with five focuses:
- Durable businesses trading at a discount.
- Low P/E companies that can generate “earnings recovery.”
- Attractively valued high-quality companies with the catalysts for change.
- Companies with predictable, sustainable earnings and cash flow growth.
- Firms with superior sales growth, leading and/or rising market share and high and/or rising margins.
The result is a fund with plenty of stocks we’ll find high up in the S&P 500’s holdings—Amazon.com (NASDAQ:AMZN), Alphabet (NASDAQ:GOOGL) and UnitedHealth (NYSE:UNH)—but also some companies that don’t get as much play in the venerable index, including ServiceNow (NYSE:NOW), Equinix (NASDAQ:EQIX) and Danaher (NYSE:DHR).
USA typically offers total-return performance that’s competitive with the S&P 500, which is no mean feat, though a much, much larger chunk of its returns come from its distributions.
Don’t Bet Against USA
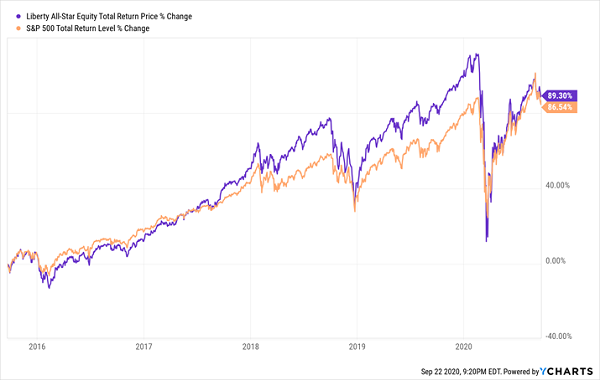
But we shouldn’t just close our eyes and buy USA anytime. This is a fund that is best bought on the rare occasion it trades at a deep, deep discount to its net asset value (NAV), which I explain in more detail here.
Currently, USA trades at a discount of less than 7% of NAV, which isn’t even as cheap as its five-year average. We should keep this fund on our watch list and wait for its discount to dip well into the double-digits.
Barings Corporate Investors
Type: High-Yield Bond
Distribution Yield: 7.4%
Let’s pivot to fixed income, where CEFs’ active management and ability to use leverage can really make a difference. Barings Corporate Investorsinvests in long-term, below-investment-grade (read: junk) debt obligations of primarily U.S. companies. If we stopped the discussion right there, it would sound a lot like the iShares iBoxx High Yield Corporate Bond ETF (NYSE:HYG) or the SPDR® Bloomberg Barclays High Yield Bond ETF (NYSE:JNK)
But MCI swims in a completely different pool. This CEF purchases the junk debt directly through mostly smaller, private companies, and these deals often come with equity features such as warrants and conversion rights.
And rather than spreading the risk across more than a thousand issues like HYG and JNK do, MCI boasts just 155 bonds, issued by the likes of mailing-software firm BCC Software and Sunrise Windows.
This makes Barings Corporate Investors a high-potential CEF, but one that really marches to the beat of its own drum. Consider that it has outperformed its plain-Jane junk-bond ETF counterparts over the past decade:
Management Gets It Right Over the Long Haul
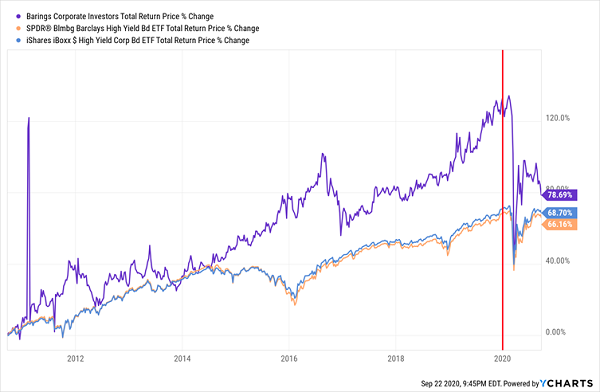
But volatile, uncorrelated returns are the norm. Just look at how it has fared in 2020:
MCI Has Been Left in the Dust
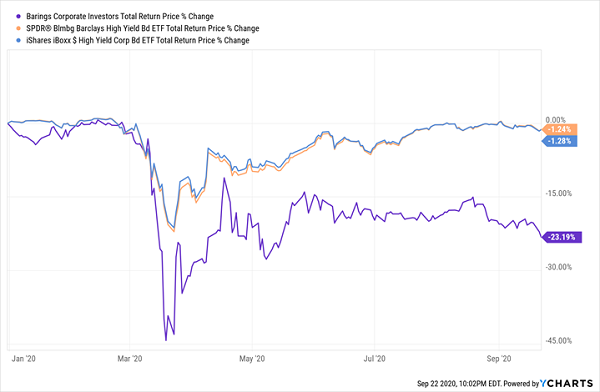
While I trust in Barings’ ability to get it right over the long haul, and while the fund trades at a deep 11% discount to NAV compared to its typical 7% premium, this is an opaque area of the market that you and I would be blindly betting on. Let’s move on to something more familiar.
Nuveen Preferred & Income Opportunities Fund
Type: Preferreds
Distribution Yield: 7.4%
I frequently tout the virtues of preferred stocks—those stock-bond hybrids that dole out high-single-digit dividends while not “wiggling” nearly as much as their underlying companies’ common stocks.
But closed-end funds (CEFs) make preferreds more potent. Reason being, CEFs can borrow money for basically nothing and reinvest the free cash into more high paying issues.
The Nuveen Preferred Income Opportunities Closed Fund (NYSE:JPC) is a 241-holding funds holding primarily preferred stock, though it does have the option of stashing assets in other income-producing instruments, such as municipal bonds and corporate debt.
Credit quality is just fine, at roughly two-thirds investment-grade, and like most preferred funds, financials dominate the holdings roster. Four of the top five industries are financials-related and make up 70% of assets.
The difference-maker is leverage. JPC has effectively borrowed 35 cents on the dollar to invest even more heavily in its targeted preferreds. This has led to stellar outperformance over the years, but as we can see, more volatility, too.
Nuveen’s JPC Is A Punchier Way To Invest In Preferreds
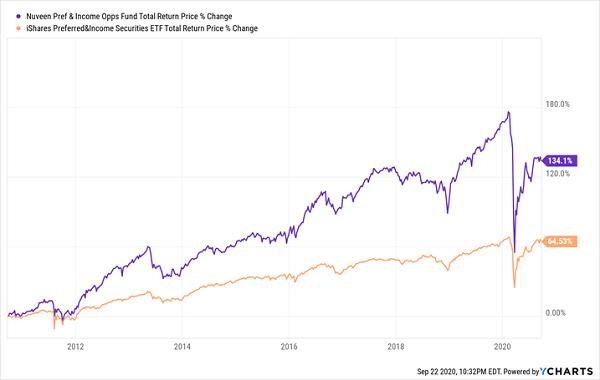
We gain more upside potential with JPC. The fund isn’t cheap right now, however, trading at a slightly lower discount to NAV than its five-year average.
Calamos Convertible & High Income Fund
Type: Multi-Sector
Distribution Yield: 8.7%
The Calamos Convertible and High Income Closed Fund (NASDAQ:CHY) invests in a portfolio of convertible securities and other high-yield fixed income instruments. Convertible securities are the lion’s share at 67%, followed by corporate bonds at 26%.
Convertible bonds get very little press. They’re like traditional bonds in that they make regular, fixed coupon payments. But as the name implies, they can be converted–into common stock. So, we can enjoy the income of bonds with the potential upside of equities.
Convertibles typically yield less than regular bonds. However, CHY’s other holdings, plus nearly 30% leverage, help fuel a big distribution of nearly 9%.
While convertibles’ yields are typically less than regular bonds, CHY’s other holdings, as well as a hefty amount of leverage, help fuel a massive distribution of more than 9% despite a slight reduction in the payout late last year. But perhaps most attractive about this Calamos fund right now is that you can buy it at an 11% discount to NAV, which is four times its historical average.
Royce Microcap Trust
Type: Micro-Cap Stock
Distribution Yield: 7.8%
If we really want to walk on the wild side, take a gander at Royce Funds, which decided back in 1993 that they could make a high-distribution product by investing some of the market’s tiniest stocks.
Royce Micro Cap Closed Fund (NYSE:RMT) boasts a 324-stock portfolio that includes the likes of quality-control product maker Mesa Laboratories (NASDAQ:MLAB) and hospitality-industry systems and service provider PAR Technology (PAR). RMT’s average holding is worth a mere $505 million in market cap, putting it near the low end of the small-cap stock range. Compare that to the small-cap Russell 2000, whose holdings average closer to $1.9 billion in size.
A handful of funds even dare to focus on micro-caps, and to Royce’s credit, RMT is a good offering, outperforming both small- and microcap indices over the past decade.
A (Slightly) Better Small-Cap Solution
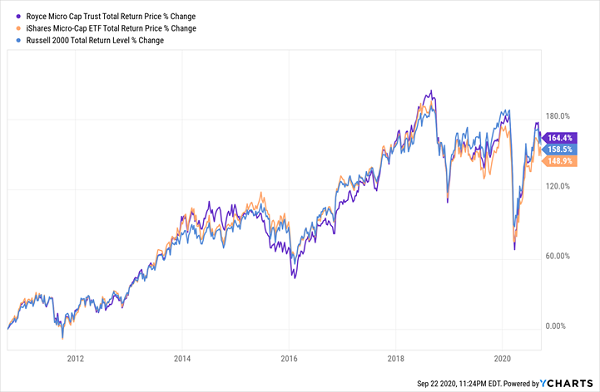
But as we can see, performance, while technically superior, is similar, and tracks very closely to the indices. That’s because RMT uses very little leverage (only 5% currently). In reality, very little of the high distribution is actual dividend income—the majority is return of capital and another significant chunk is long-term gains.
Royce Micro-Cap Trust might have a place in some retirement portfolios—it’s a way to add small-cap diversification while collecting returns on a consistent basis. But if your goal is safe, high levels of income, you can find far more reliable sources than a basket of the market’s chanciest stocks.
Disclosure: Brett Owens and Michael Foster are contrarian income investors who look for undervalued stocks/funds across the U.S. markets. Click here to learn how to profit from their strategies in the latest report, "7 Great Dividend Growth Stocks for a Secure Retirement."
