5 Commodities Futures Charts Signal 4 Drops, 1 Gain Ahead

Published 12/14/2020, 12:06 AM
Updated 07/09/2023, 06:31 AM
UK100
-
XAU/USD
-
GC
-
CL
-
NYF
-
GPR
-

As we prepare for the week ahead, let’s glance at some charts of long-term commodities. I have a few things to say about each in the caption area.
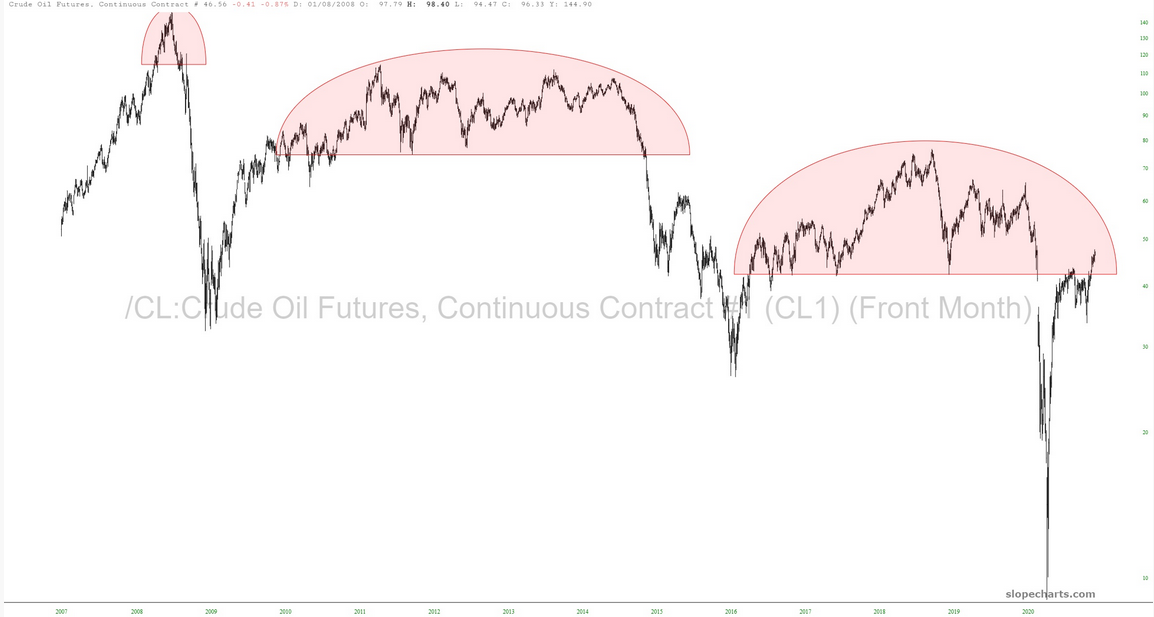
Crude Oil Futures Chart

We begin with crude oil. In the bears’ favor is the enormous rounded top and oil’s history of sinking hard beneath such tops. This is dulled somewhat due to recent price action, which has pierced the pattern. This pattern is down, though, and not out.
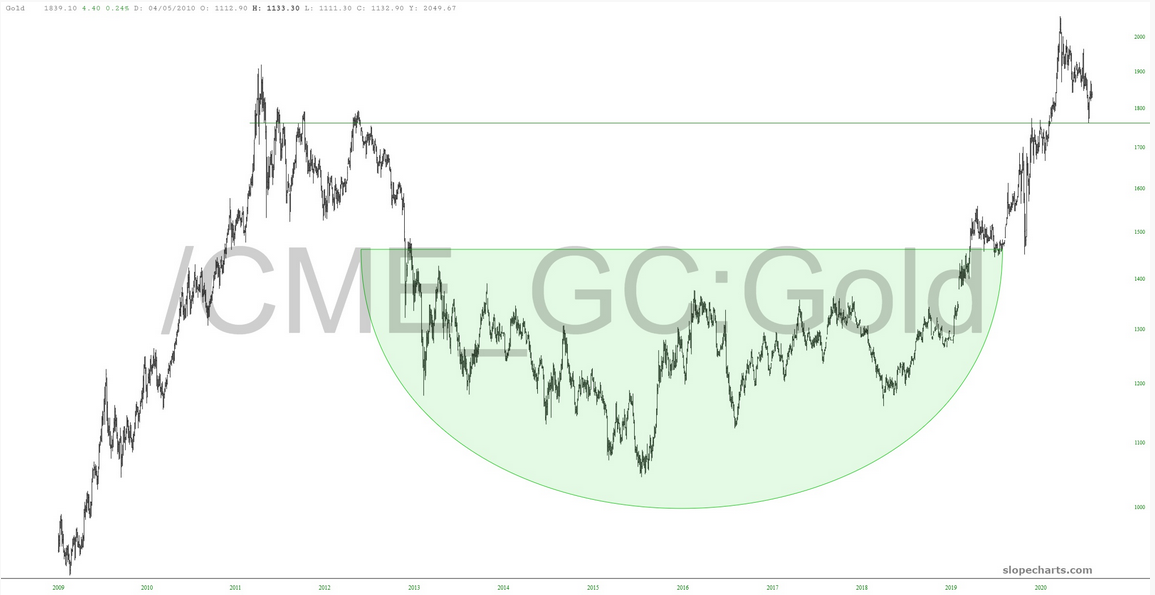
Gold Chart

Gold continues to be my favorite long-term bullish pattern. It has stunk since August 6, but three months is just a blip in the context of this huge chart.
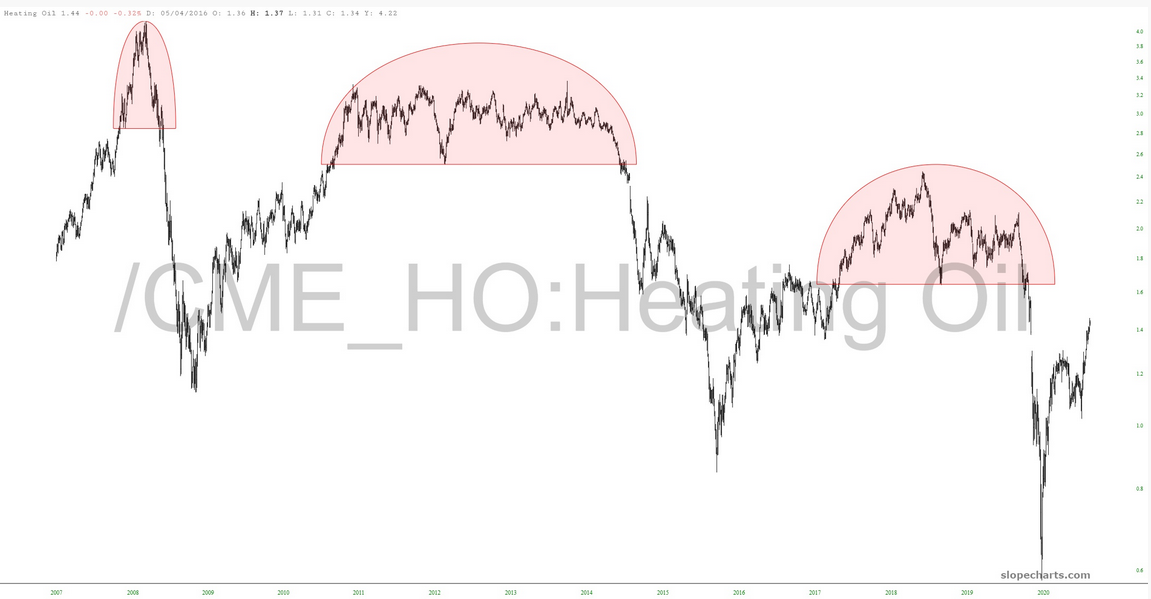
Heating Oil Chart

Similar to crude oil, heating oil has completed its third huge bearish setup. And, unlike crude oil, it has left its recent topping pattern pristine.
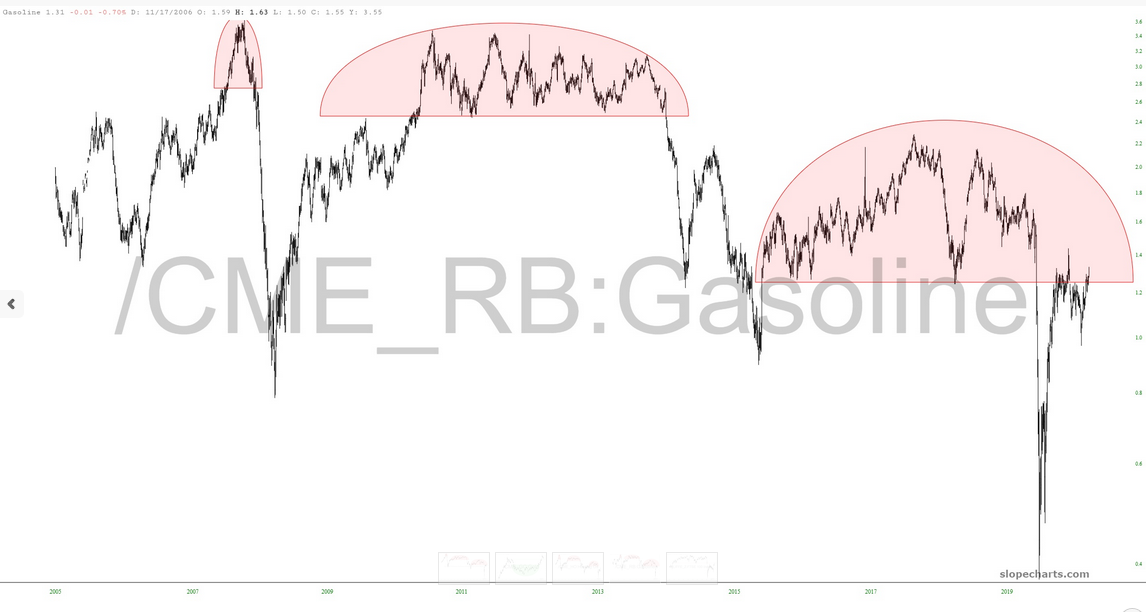
Gasoline Chart

Much the same can be said, unsurprisingly, of gasoline futures.
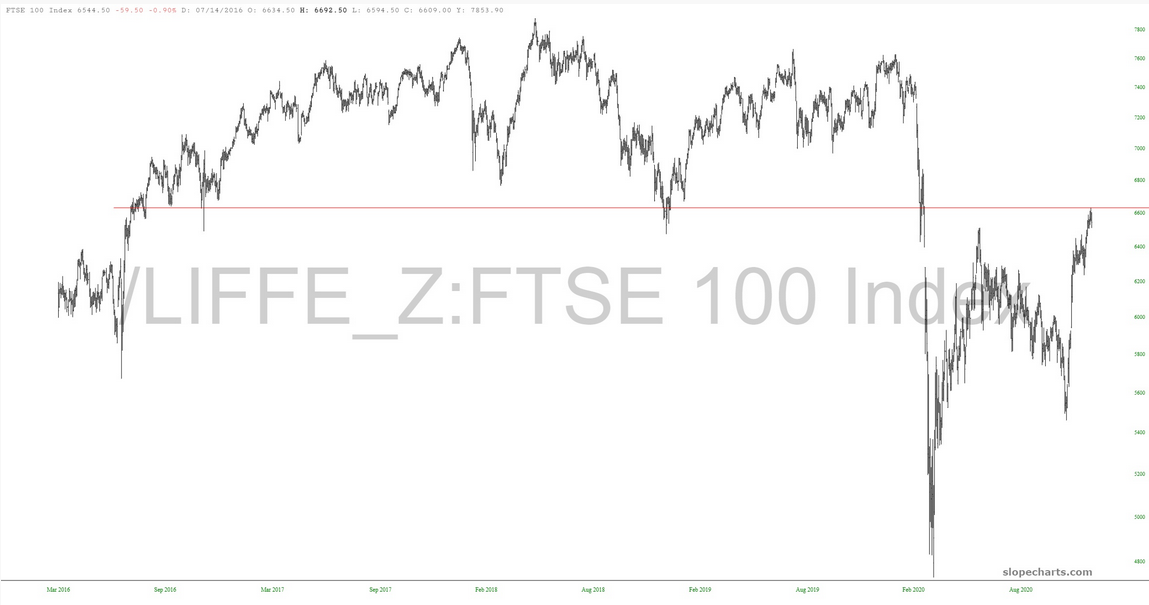
FTSE 100 Index Chart

Finally, the London FTSE equity futures (the FTSE 100 trading on LIFFE is sporting a king-sized one of overhead supply. The easy gains are in the rear view mirror. This is high-risk.

Latest comments

Loading next article…
Risk Disclosure: Trading in financial instruments and/or cryptocurrencies involves high risks including the risk of losing some, or all, of your investment amount, and may not be suitable for all investors. Prices of cryptocurrencies are extremely volatile and may be affected by external factors such as financial, regulatory or political events. Trading on margin increases the financial risks.
Before deciding to trade in financial instrument or cryptocurrencies you should be fully informed of the risks and costs associated with trading the financial markets, carefully consider your investment objectives, level of experience, and risk appetite, and seek professional advice where needed.
Fusion Media would like to remind you that the data contained in this website is not necessarily real-time nor accurate. The data and prices on the website are not necessarily provided by any market or exchange, but may be provided by market makers, and so prices may not be accurate and may differ from the actual price at any given market, meaning prices are indicative and not appropriate for trading purposes. Fusion Media and any provider of the data contained in this website will not accept liability for any loss or damage as a result of your trading, or your reliance on the information contained within this website.
It is prohibited to use, store, reproduce, display, modify, transmit or distribute the data contained in this website without the explicit prior written permission of Fusion Media and/or the data provider. All intellectual property rights are reserved by the providers and/or the exchange providing the data contained in this website.
Fusion Media may be compensated by the advertisers that appear on the website, based on your interaction with the advertisements or advertisers.
© 2007-2025 - Fusion Media Limited. All Rights Reserved.