The average price-to-earnings ratio of the S&P 500 is now 25, and the cyclically-adjusted price-to-earnings ratio is over 31.
But the financial sector’s average price-to-earnings ratio is less than 17.
Banks and insurers usually trade at lower valuations than the broad market, due to the amount of leverage and interest rate sensitivity they have compared to other industries. When a recession hits and consumers are unable to pay back their debts, banks are among the first companies to take a hit to their bottom line.
There’s a lot of money to be made by buying bank stocks at good valuations that are financially sound. They are typically good dividend stocks, their business is straightforward, and with high switching costs, they have built-in economic moats around their revenue streams.
This article takes a look at the health of the overall U.S. banking industry to see if they are still good investments this far into the market cycle. Click on the images for a bigger view.
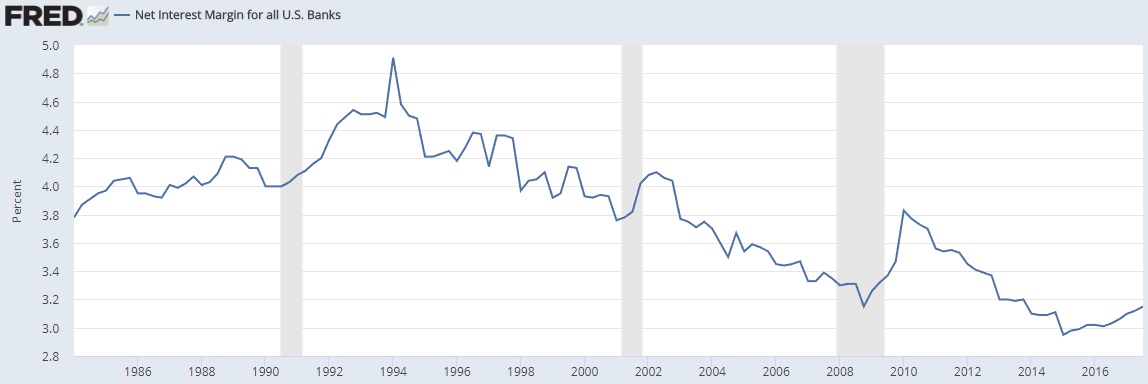
1) Net Interest Margin
Source: Federal Reserve Bank of St. Louis
The core business of a bank is to borrow money at a low interest rate via checking and savings accounts and lend it at a higher rate via mortgages, auto loans, credit card accounts, and personal loans. Many of them have other forms of revenue such as payment processing, asset management or custodianship, and taking care of routine issues like medallion signature guarantees or notarization, but the difference between borrowing and lending is where the majority of banks make most of their money.
The net interest margin is the difference between the lending rate and the borrowing rate, and the above chart shows the banking industry average net interest margin.
In the 1980’s and 1990’s it was generally over 4%, but thanks to the decade of low interest rates following the 2008 global financial crisis, it has more recently been around 3%. This seems like a small difference, but if this were to go back up to 4% it would represent a 33% increase in net interest income at no additional expense, which would substantially boost the bottom line. Even going from 3% to 3.3% is a solid 10% net interest income boost.
Federal Reserve interest rates have been near-zero for a decade now, but from 2010 to 2015 the average bank net margin continued to decrease because more and more consumers were refinancing their existing fixed debts at these low rates. Now that interest rates are inching back up and refinancing is not as big of a deal anymore, the net interest margin is also inching back up.
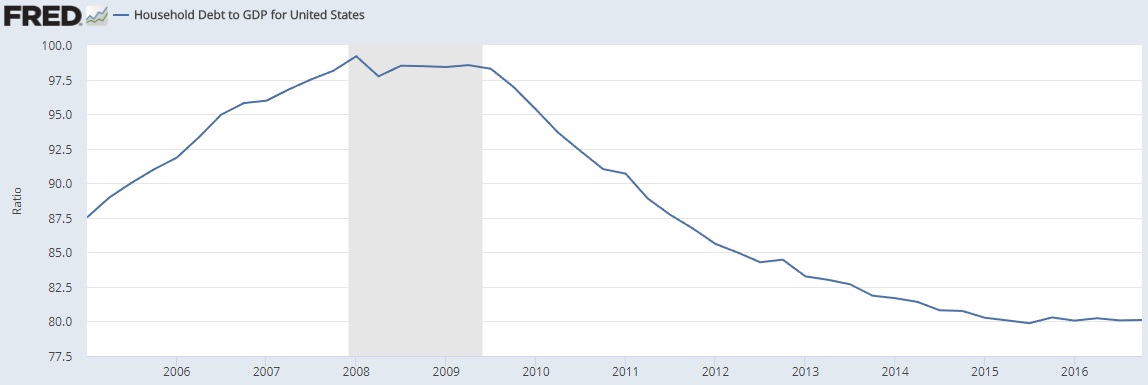
2) Household Debt to GDP
Source: Federal Reserve Bank of St. Louis
Since banks own most consumer debt, it’s important to keep an eye on how leveraged the American public is.
The above chart shows that at 80% household debt to GDP, we’re a lot less leveraged than we were in the years leading up to the previous recession.
However, up until around 1990, Americans kept their household debt to GDP at under 60%. The current trend is positive in favor of debt reduction, but the long term change has been towards more leverage.
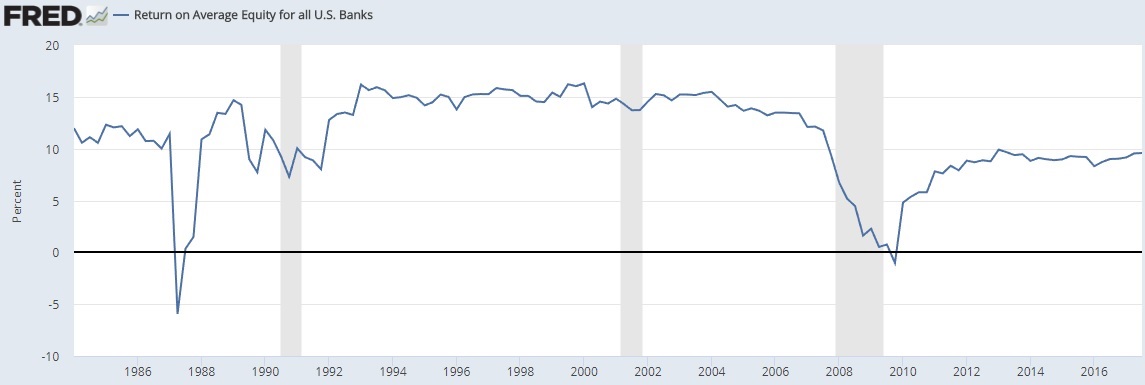
3) Return on Equity
Source: Federal Reserve Bank of St. Louis
Return on equity is a key measure of profitability for banks.
Equity is the difference between assets and liabilities, and the return on equity is the ratio of the company’s net income divided by its equity. In other words, it measures how much money the company makes in a year as a percentage of money it currently has.
The 1990’s and 2000’s were a period of high bank returns on equity at about 15% on average, but this was shown to be hollow as the global financial crisis erased much of those gains.
Now with tighter regulation, banks are back down to about 10% average return on equity.
Banks that hold considerable revolving credit, like American Express (NYSE:AXP), Discover Financial Services (NYSE:DFS), and Synchrony Financial have returns on equity of 15-20% or higher, but in exchange are a bit riskier as well.
4) Equity to Assets
Source: Federal Reserve Bank of St. Louis
Banks currently have more equity to assets than they did in the past, partly due to regulation, which means more liquidity and less leverage.
Let’s use Wells Fargo (NYSE:WFC) as an example. According to Morningstar, they have $1.93 trillion in assets, $1.73 trillion in liabilities, and about $200 billion in equity, which gives them an equity to asset ratio of a little over 10%, or just below the industry average of 11% as shown on the chart.
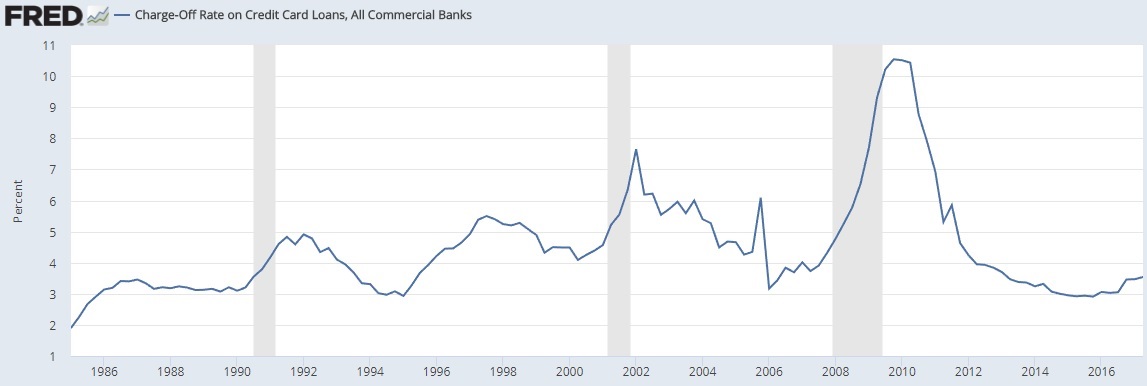
5) Credit Card Charge-Offs
Source: Federal Reserve Bank of St. Louis
Credit cards are among the riskiest types of loans for banks, because they face much higher default rates than mortgages and other conservative lending in times of financial stress. They correlate very well to broader consumer loans in general, but with higher peaks.
The credit card industry has sharply watched the charge off rate of credit cards this past year, which is a measurement of the percentage of credit card debt that ultimately goes bad, because it has been inching back up. Due to this, about 10% of banks are beginning to tighten their credit card lending standards.
At around 3.5%, it’s still very much in healthy territory, and below what it typically was in the 1990’s and 2000’s.
Final Thoughts
We’re eight and a half years into the third longest economic expansion in U.S. history.
This makes some investors nervous, especially with stock valuations so high. And I certainly agree with them; I think there’s a lot more downside risk in the market with these valuations compared to upside potential over the next 5-10 years.
But I do like buying banks that are trading at low earnings multiples and that are positioned to hold up well during the next recession, whenever it may come. Overall, the banking industry appears to be in relatively good shape. Consumers are a bit less leveraged than they were a decade ago, and banks have more liquidity than ever, in exchange for earning lower (but still decent) returns.
And at this stage, it appears that some of the most volatile banks, with high exposure to credit card debt, are actually some of the best-positioned banks. This is because although they have riskier assets, they also trade at lower valuations, earn higher returns on assets and equity, have extra capital on hand to protect their loans, and they comfortably pass bank stress tests.
The state of credit card lending is still very much in healthy territory in 2017.
Full Disclosure: Author is long Synchrony Financial and Discover Financial Services.


