Today marks the seventh day of Hanukkah, and in only seven days, many families across the world will be celebrating Christmas. Not only is it the season of giving, but it’s also time to reflect back on the past 12 months and look ahead to 2018.
Below are five questions to help guide your thinking when making investment decisions in the new year.
1. Will stocks follow the historical presidential cycle?
Next month marks President Donald Trump’s first year in office and the beginning of his second. How have markets responded to his pro-growth policies, including pledges to lower taxes and slash regulations?
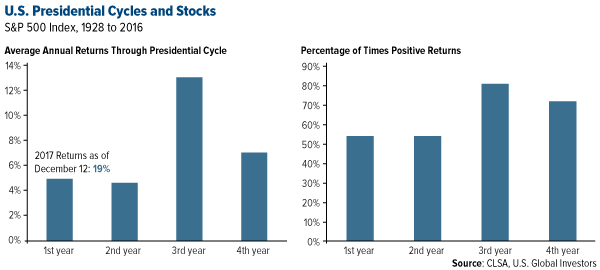
The answer: Overwhelmingly. As of my writing this, the S&P 500 Index is up 19 percent year-to-date, far outperforming the historical returns we’ve seen in the first year of a president’s four-year term.
In the second year, returns have traditionally been lower than the first. From 1928 to 2016, such years produced average market gains of just above 4 percent, making it the weakest year.
The reason for lower returns in the first two years, according to CLSA analysts this week, could be that “an administration looks to put as much bad news and painful actions into the first two years to form a good bias for getting reelected or paving the way for the predecessor of its own party.” Recall that President Bill Clinton didn’t hesitate to hike taxes after getting elected–he signed the Omnibus Budget Reconciliation Act just eight months into his first term.
But Trump has taken a different strategy. As CLSA puts it, “all the good news is being front loaded in the first half of this presidential cycle.” Right out of the gate, Trump placed major executive and legislative agenda items on the docket, from an Obamacare repeal to deregulation to sweeping tax cuts.
Not all of these efforts have borne fruit, of course. Even last week, his tax overhaul appeared to be imperiled after serious concerns were raised by moderate Republican senators such as Marco Rubio, Bob Corker and Jeff Flake.
I remain optimistic, though, and I see no reason at the moment to think that 2018 won’t be an encore of 2017. We’re nine years into the current equities bull market, the second-longest in U.S. history, but there could still be plenty of “gas in the tank,” according to a Bank of America Merrill Lynch (NYSE:BAC) report this week.
So with only a month remaining to Trump’s first term, it’s important to remember the words of Warren Buffett a day before the president was sworn in. Even though Buffett backed Hillary Clinton in the election, he said that “America works and I think it’ll work fine under Donald Trump.”
2. Will S&P 500 Index companies continue to post record-level earnings per share (EPS) in 2018?
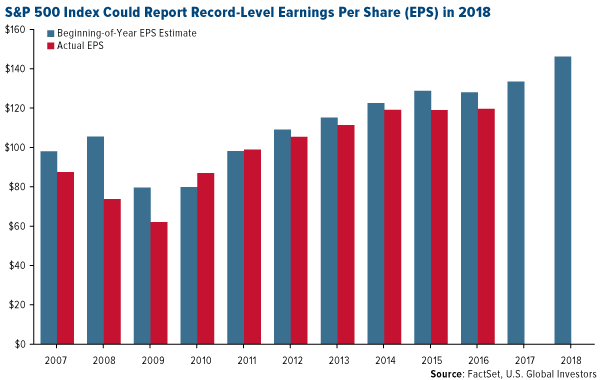
Earnings per share (EPS) growth is one of the most reliable and closely monitored indicators of market health. It’s one of the key metrics we use to find the most growth-driven and profitable companies.
As my good friend Alex Green said in an interview back in August, “if you look back through history, you’d be hard-pressed to find a single example of a company that increased its earnings, quarter over quarter, year after year, and not see its stock tag along.”
Except for a slight dip from 2014 to 2015, when EPS for the S&P 500 Index fell from $119.70 to $117.55, earnings have been rising steadily since 2009.
As of today, EPS for 2017 stands at $133.73, a new record and up nearly 13 percent from last year.
Next year we could see them climb even higher, if estimates prove to be accurate. In a report last week, FactSet analysts predict EPS by year-end in 2018 to reach $143.17, a 7 percent increase from 2017.
In other words, the American stock market is poised to continue its record-setting bull run in 2018.
3. Can small and mid-size businesses get any more pumped than they are now?
The short answer here is: Yes, they can–but not by much before a new all-time record is reached.
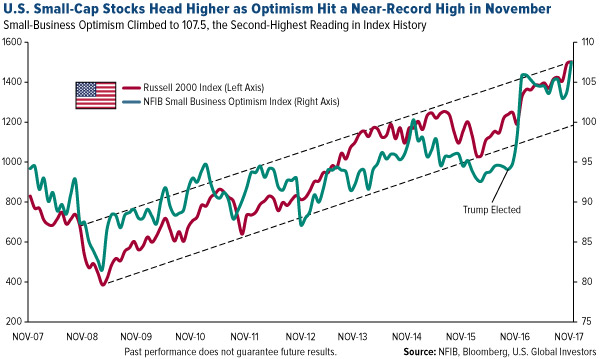
For the past 44 years, the National Federation of Independent Business (NFIB) has taken a monthly survey to measure the optimism of small-business owners, and in November, the index climbed to a skyscraping 107.5. That’s the second-highest reading ever, after the index hit 108.0 way back in July 1983 on the hopes of additional Reagan tax cuts.
If we drill down into the various index components, we find that owners are most optimistic about the next three months, with 27 percent saying it will be a “good time to expand,” up from only 11 percent one year ago. They’re ready to unleash capital, buy new equipment and increase labor.
In their monthly commentary, NFIB economists William Dunkelberg and Holly Wade wrote: “There is still much uncertainty about health care and taxes, but it appears that [small-business] owners believe that whatever Congress finally comes up with will be an improvement and so they remain positive.”
That positivity is shared by small-cap stock investors, who’ve driven up the Russell 2000 Index more than 12 percent since the beginning of the year.
Explore investment opportunities in small and mid-cap companies!
4. What will drive gold prices higher?
As of Friday, gold was up more than 9 percent for the year. If it stays at its current price level, gold will log its best year since 2011, when it returned 10 percent.
The yellow metal has faced a number of significant headwinds in 2017, including surging equity markets around the world and rate hikes by the Federal Reserve. Under the circumstances, I would describe its performance as highly respectable.
Potential tailwinds in 2018 could help the yellow metal crack the $1,300 level and head higher.
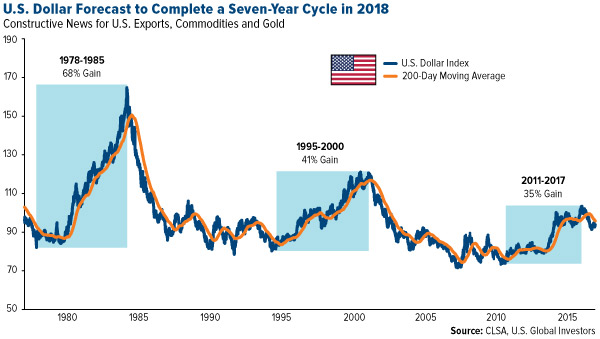
That includes a weaker U.S. dollar. CLSA analysts this week noted that the dollar has traditionally risen in seven-year cycles. Between 1978 and 1985, it gained 68 percent; between 1995 and 2000, 41 percent. The current bull market so far has seen the dollar rise 35 percent, which has been a challenge for gold, commodities and U.S. exports.
That might be set to change in 2018, when we could see a completion of the seven-year cycle. As CLSA writes, “our tactics through 2018 would be to sell U.S. dollar strength in anticipation of break below 91-92 support.”
Other possible tailwinds include geopolitical risks, negative real interest rates across the globe, continually expanding global debt and overvalued equities.
On Monday, the North Atlantic Treaty Organization (NATO) raised concerns that Russia has developed a ground-launched cruise missile system that might violate a 1987 Cold War pact banning such weapons. It’s believed the missile system would be able to strike Europe on very short notice. Meanwhile, the U.S. State Department is working around the clock to dissuade North Korea from continuing its nuclear weapons program. As a store of value, gold has historically performed well in such uncertain times.
Meanwhile, two-year government bond yields in a number of European countries–the Netherlands, Germany, Austria, Belgium, France, Spain and more–are below zero. As I’ve explained many times before, negative real rates have traditionally been constructive for gold in that particular country’s currency.
Finally, there’s some concern that too much money is flowing into equities right now. According to Bloomberg, the total market cap for world equities is now just a “whisker” away from hitting $100 trillion–a monumental sum, to be sure. Should there be a correction, the investment case for gold and precious metals will become stronger than ever.
5. Can anything stop bitcoin?
Bitcoin made some people a whole lot of money this year. One year ago today, the cryptocurrency was trading in the $770 to $780 range. On Friday, it briefly broke above $18,000. That’s a phenomenal return of 2,200 percent. The total market cap of all cryptocurrencies has already crossed above $500 billion and is well on its way to $1 trillion.
So is there anything that could stop its progress?
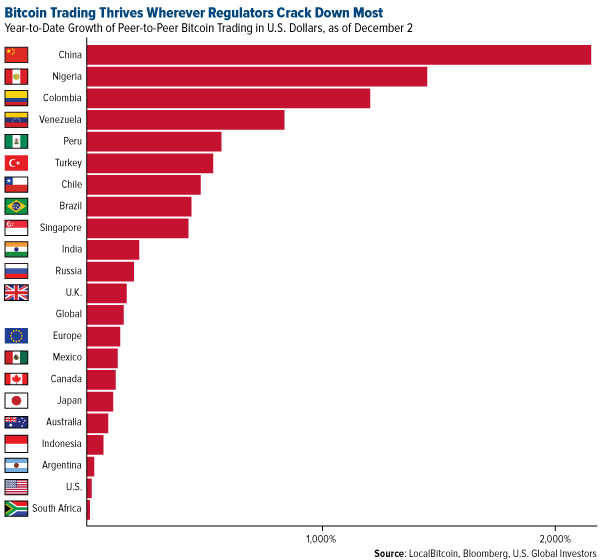
The most obvious answer might be regulations, but remember, bitcoin made these unexpected gains even as several countries clamped down on the digital currency. Venezuela, which will introduce its own government-sanctioned cryptocurrency, is scheduled to begin regulating bitcoin, but as the bolivar loses more and more of its value, residents have had to rely on bitcoin to survive.
It’s not surprising at all to see that bitcoin has undergone the greatest surge in peer-to-peer trading in countries that have imposed some of the most stringent regulations on cryptocurrencies. This is a currency, after all, that does not require any third-party involvement to trade. It’s able to bypass governments, central banks and borders with ease.
As I said last week, this is precisely why bitcoin is appealing to many investors. And according to Metcalfe’s law, more investors could mean higher ask prices.
Bitcoin might be very appealing right now, but it’s important to keep in mind that this has been a very volatile market. If I didn’t readily have the money to buy bitcoin, I wouldn’t go into debt and certainly wouldn’t mortgage my house to get my hands on it, as some people are reportedly doing.
I wish you all a Happy Hanukkah and Merry Christmas!
All opinions expressed and data provided are subject to change without notice. Some of these opinions may not be appropriate to every investor. By clicking the link(s) above, you will be directed to a third-party website(s). U.S. Global Investors does not endorse all information supplied by this/these website(s) and is not responsible for its/their content.
The S&P 500 Stock Index is a widely recognized capitalization-weighted index of 500 common stock prices in U.S. companies. The Russell 2000 Index is a small-cap stock market index of the bottom 2,000 stocks in the Russell 3000 Index. The index is maintained by FTSE Russell, a subsidiary of the London Stock Exchange Group (LON:LSE).
The U.S. Dollar Index (USDX, DXY) is an index (or measure) of the value of the United States dollar relative to a basket of foreign currencies, often referred to as a basket of U.S. trade partners’ currencies.
The NFIB Small Business Economic Trends is an index derived from 10 components, with 1986=100. The index is seasonally adjusted for variations within the year. Monthly surveys are derived from a large sample of respondents drawn from the membership files of the NFIB. The NFIB survey provides an early health check on small businesses, which are critical to the economy. Small businesses account for about half of the nation’s private workforce.
The SPDR S&P 500 ETF Trust (AX:SPY) was trading at $268.32 per share on Monday afternoon, up $1.81 (+0.68%). Year-to-date, SPY (NYSE:SPY) has gained 21.15%.
SPY currently has an ETF Daily News SMART Grade of A (Strong Buy), and is ranked #1 of 140 ETFs in the Large Cap Blend ETFs category.

