Here is your Bonus Idea with links to the full Top Ten:
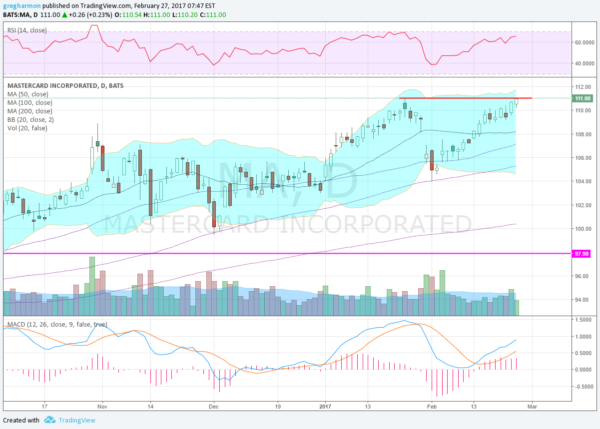
Mastercard Inc (NYSE:MA), has been trending higher since July 2016. It paused in November and pulled back before a surge higher to a peak at 111 in January. The pullback from there made for a higher low and the price steamed higher back to the prior high. This is where it will enter the new week. With the RSI making a lower low while price did not, a Positive RSI Reversal has set up with a target to 112. Not very far away.
But the RSI is bullish and rising with the MACD moving higher and bullish as well. The Bollinger Bands® are turning and opening higher now at resistance. This allows for a move higher. The SMA’s are trending higher as well, a great trend. There is no resistance over 11 and support lower comes at 109 and 107 followed by 105.75. Short interest is low under 1%. The stock trades ex-dividend April 5th and the company is expected to report earnings next April 27th.
Options chains show a lot of open interest this week at 11 on the call side and smaller at 112. On the put side it is all lower. This suggests a view of no upside this week. March Expiry shows open interest pointing to a draw to 110. The April options show some potential for upside with big open interest at 115, but also at 110 and then at 100 on the put side. The July options, the first beyond the next earnings report, show the biggest open interest at 110 with the call side also having size at 115 and 120, and the put side at 100.

Trade Idea 1: Buy the stock on a move over 111 with a stop at 110.
Trade Idea 2: Buy the stock on a move over 11 with a March 111/108 Put Spread (93 cents) and selling an April 115 Call (88 cent credit).
Trade Idea 3: Buy the April 110 Bullish Risk Reversal ($1.00).
Trade Idea 4: Buy the April 110/March 113 Call Diagonal ($2.55) and sell the March 108 Puts (47 cents).
After reviewing over 1,000 charts, I have found some good setups for the week. These were selected and should be viewed in the context of the broad Market Macro picture reviewed Friday which heading into March sees the Equity markets still looking strong on the longer time frame but showing more signs of short term weakness taking hold.
Elsewhere look for Gold to continue higher in its uptrend while Crude Oil churns with a bias for a break to the upside. The US Dollar Index still looks better to the upside while US Treasuries consolidate further. The Shanghai Composite continues to drift higher while Emerging Markets are showing some weakness in their uptrend.
Volatility looks to remain at abnormally low levels keeping the wind at the back of the equity index ETF’s SPY (NYSE:SPY), iShares Russell 2000 (NYSE:IWM) and PowerShares QQQ Trust Series 1 (NASDAQ:QQQ). Their long term charts all continue to look strong while the short term charts hit a set back and may continue a drift lower short term. Use this information as you prepare for the coming week and trad’em well.
The information in this blog post represents my own opinions and does not contain a recommendation for any particular security or investment. I or my affiliates may hold positions or other interests in securities mentioned in the Blog, please see my Disclaimer page for my full disclaimer.
