Visa
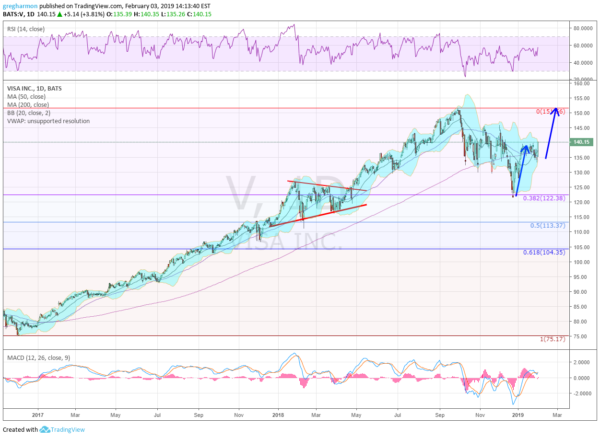
Visa (NYSE:V), started moving higher at the end of 2016. It paused to consolidate in a triangle the first 4 months of 2018 and then resumed the path higher. It eventually topped out at the end of September last year. It pulled back hard at first, to the 200 day SMA, and then bounced. Two more bounces near the 200 day and then the price dropped lower in December.
It stopped at a 38.2% retracement of the move higher and near the center of the prior triangle. It did not stay there long though and made a “V” recovery to the prior chop area. A short pullback and then Friday it pressed hard to the upside. This gives a target to the prior high at 151.60.
As it resumes higher the RSI is pressing on the edge of a move into the bullish zone with the MACD positive and crossing back higher. The Bollinger Bands® have squeezed often a precursor to a big move and price is now over the 200 day SMA again.
There is resistance at 142.70 and 145.30 then 148 and 151. Support lower comes at 136.50 and 133.10 then 130 and 128 before 123. Short interest is low at 1.7%. The company does not report again until April 23rd, but the stock pays a small dividend and starts trading ex-div on February 14th.
The options chains show the February Expiry has the highest open interest on the put side at the 135 strike. But that is small compared to the interest at the 147 call. Even the 135 and 140 call are bigger. March open interest is biggest at the 145 call and about 1/3 the size at the 125 and 130 puts.
In April it is just starting to build. The June options are the first to cover the next earnings report and show a plateau of open interest from 115 to 140 on the put size. This is smaller than the call side ramp starting at 130 and peaking at 165.
Visa, Ticker: $V

Trade-Ideas
- Buy the stock on a move over 140.50 with a stop at 137.
- Buy the stock on a move over 140.50 and add a February 140/135 Put Spread ($1.50) while selling a March 145 Call ($1.40) to pay for the protection.
- Buy the March/April 145 Call Calendar for $1.55.
- Buy the June 125/150/160 Call Spread Risk Reversal for 10 cents.
After reviewing over 1,000 charts, I have found some good setups for the week. These were selected and should be viewed in the context of the broad Market Macro picture reviewed Friday which with January in the books as the best in 30 years and the first week of February ahead, sees equity markets continuing to look strong as they push higher.
Elsewhere look for Gold to continue in its uptrend while Crude Oil looks to break higher as well. The U.S. Dollar Index continues to mark time moving sideways while U.S. Treasuries are at resistance. The Shanghai Composite is building a reversal and Emerging Markets have confirmed a reversal higher.
Volatility looks to remain low and falling keeping the breeze at the backs of the equity index ETF’s SPY, IWM and QQQ. Their charts show a possible pause in the short term but the longer picture continues to look strong, as they close in on printing the first higher high since the drop. Use this information as you prepare for the coming week and trad’em well.
The information in this blog post represents my own opinions and does not contain a recommendation for any particular security or investment. I or my affiliates may hold positions or other interests in securities mentioned in the Blog, please see my Disclaimer page for my full disclaimer.
