Here is your Bonus Idea with links to the full Top Ten:
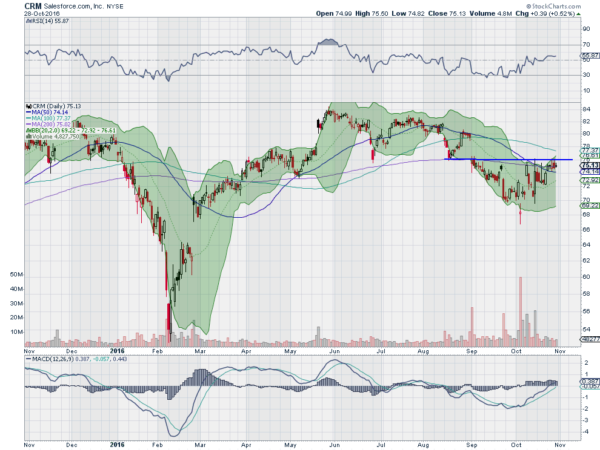
Salesforce.com made a low in February after a more that 355 drop over 2 months. The path higher took the next 4 months and made a new higher high in June. From there the stock price languished moving in consolidation against a falling trend resistance and horizontal support. A descending triangle had formed. It broke that triangle to the downside in September, eventually retracing 50% of the move higher from that February low and at the target move out of the triangle.
The Spinning Top doji at the low was confirmed higher the next day and the stock has been moving higher since. Friday saw it end the week back just under $76, which has been an important price level since early May, first as support in the triangle, and then since September as resistance.
As it sits there the RSI is rising and on the edge of a move into the bullish zone while the MACD is rising and positive. The Bollinger Bands are also opening to the upside to allow a move higher. There is a gap to fill to 78.94 above and resistance above 76 stands at 77.70 and then 80.40 and 82.70 before the 84.48 top. Support lower may come at 74 and 72 followed by 70 and 68. Short interest is low at 2.8%.
The November 4 Expiry options chain shows large open interest on the call side at the 74.50 and 75 strikes and then again at the 79 strike. The November monthly chain, the first after the company reports earnings on the 17th, shows open interest much larger on the call side and biggest at the 72.5, 75 and 77.50 strikes.
Salesforce.com Inc (NYSE:CRM)
Trade Idea 1: Buy the stock on a move over 76 with a stop at 74.
Trade Idea 2: Buy the stock on a move over 76 with a November 75/70 Put Spread ($1.75) and selling a December 85 Call (55 cents).
Trade Idea 3: Buy a November 75/77.5 Call Spread ($1.20) and sell the November 70 Put (95 cents).
Trade Idea 4: Buy the November/December 80 Call Calendar (70 cents) and sell the November 70 Put (95 cents).
After reviewing over 1,000 charts, I have found some good setups for the week. These were selected and should be viewed in the context of the broad Market Macro picture reviewed Friday which heading into the last week full week before the election the equity markets continue to look troubled on the short timeframe, with the weakness starting to leak into the longer timeframe for the small caps.
Elsewhere look for Gold to drift higher while Crude Oil continues the short term move lower. The US Dollar Index looks ready for consolidation or a pullback short term while US Treasuries are biased lower. The Shanghai Composite looks to continue to drift higher as Emerging Markets are biased to the downside in consolidation.
Volatility looks to remain in the normal range but creeping up so adding a headwind for the equity index ETF’s SPDR S&P 500 (NYSE:SPY), iShares Russell 2000 (NYSE:IWM) and PowerShares QQQ Trust Series 1 (NASDAQ:QQQ). Their charts also show short term weakness with the IWM the weakest as it falls and the SPY next but the QQQ still holding near all-time highs. Use this information as you prepare for the coming week and trad’em well.
DISCLAIMER: The information in this blog post represents my own opinions and does not contain a recommendation for any particular security or investment. I or my affiliates may hold positions or other interests in securities mentioned in the Blog, please see my Disclaimer page for my full disclaimer.
