Here is your Bonus Idea with links to the full Top Ten:
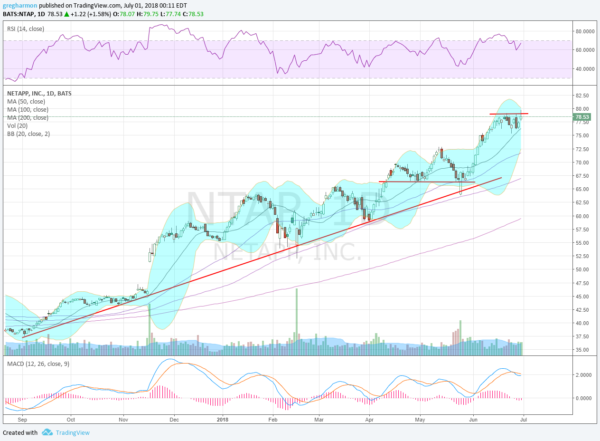
NetApp (NASDAQ:NTAP) had a strong run higher following trend support from September 2017 until now. The last 3 weeks it has consolidated against resistance just under 80 and above the 20 day SMA. The Bollinger Bands® are squeezing in, often a precursor to a move. The RSI is rising in the bullish zone with the MACD turning back up, a bullish signal. The price is extended from the trend support so it is a risk of a pullback.
But there is a strong trend with a Measured Move higher to 91 on a break to the upside. There is no resistance over 79.25 and support lower comes at 76.30 and 72.85 then 69.75 and 66.35 before 64. Short interest is moderate at 5.2%. The company is expected to report earnings next on August 15th. It also pays a 40 cent dividend, a 2% yield, and trades ex-dividend July 5th.
The July options show big open interest at the 75 put strike and then much bigger at the 84 calls. The August options show that traders look for a $8.50 move between now and expiry with the biggest open interest at the 75 and 80 put strikes. Call open interest is small. The September chain shows the biggest open interest at the 75 put and on the call side biggest at 70 and tailing at 85.
Trade Idea 1: Buy the stock on a move over 79 with a stop at 76.
Trade Idea 2: Buy the stock on a move over 79 and add a August 75/70 Put Spread ($1.46) while selling the September 90 Calls ($1.22) to fund it.
Trade Idea 3: Buy the August 80/July 82 Call Diagonal ($3.70) and sell the July 72 Puts for $3.30.
Trade Idea 4: Buy the July 79/84 Call Spread ($1.33) and sell the July 75 Put for 56 cents.
After reviewing over 1,000 charts, I have found some good setups for the week. These were selected and should be viewed in the context of the broad Market Macro picture reviewed Friday which as we close the books on the 2nd Quarter and prepare for a holiday shortened 4th of July week, sees that the equity markets look to have run out of gas. Maybe the short week will re-energize them. All there indexes had a positive quarter with the IWM just out pacing the QQQ, 7.9% to 6.5% and the SPY gaining 3.1%. The QQQ won the month up 0.9% to the 0.6% for the IWM and the SPY eked out a 0.1% gain. The monthly candles all look toppy with long upper shadows, while the quarterly candles are all looking strong.
Elsewhere Gold looks as it may pause in its downtrend while Crude Oil continues to race higher. The US Dollar Index is pausing in its uptrend while Treasuries are on the edge of a break out to the upside. The Shanghai Composite may be ready to pause in its downtrend while Emerging Markets are setting up for a possible reversal higher. Volatility looks to remain low but above recent levels keeping the wind at the backs of the equity markets but the breeze blowing softer.
The equity index ETFs SPY, IWM and QQQ, all had a mixed week with early signs of strength Friday fading into the close, leaving questions about the short term. The longer weekly time frame was much less troublesome showing consolidation for the SPY continuing and the IWM and QQQ digesting recent moves higher. Use this information as you prepare for the coming week and trad’em well.
The information in this blog post represents my own opinions and does not contain a recommendation for any particular security or investment. I or my affiliates may hold positions or other interests in securities mentioned in the Blog, please see my Disclaimer page for my full disclaimer.

