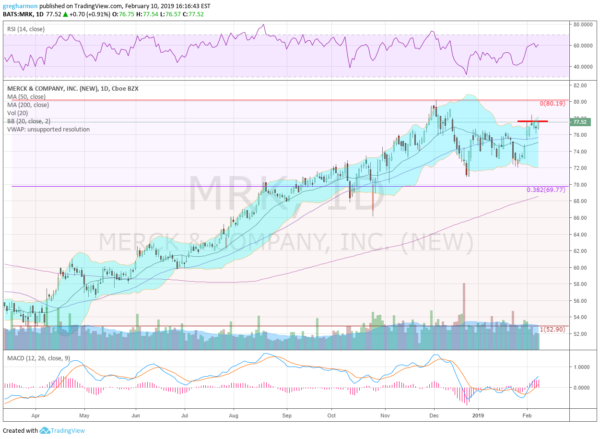
Merck & Company Inc (NYSE:MRK), ended a run higher in December, but only pulled back less than 38.2% of that move. In January it made a higher low and reversed to the current consolidation. It sits there with a RSI on the edge of retaking the bullish zone and the MACD rising and positive.
There is resistance at 77.75 and 79 then 80.25. Support lower comes at 76.25 and 74.50 then 72. Short interest is low at 1.6%. The stock pays a 3.28% dividend and starts trading ex-dividend March 14th. The company is expected to report earnings next on April 30th.
The February options chain shows big open interest at the 73 and 75 strikes on the put side. It is comparable at the 73.50, 75 and 77.50 strikes on the call side but much bigger at the 80 strike. March options see open interest focused from 62.50 to 75 on the put side and bigger size from 75 to 80 on the call side.
April options are similar with put open interest focused from 65 to 75 and calls bigger at 75 and 80. June options are the first to cover the earnings report and show put open interest spread from 50 to 75. On the call side it is big at 65 but also 77.50 and 80.
Merck, Ticker: $MRK

Trade Ideas For Merk
- Buy the stock on a move over 77.75 with a stop at 75.50.
- Buy the stock on a move over 77.50 and add a March 77.50/72.50 Put Spread ($1.35) while selling a June 82.50 Covered Call ($1.10) to pay for it.
- Buy a March/June 80 Call Calendar ($1.50).
- Buy a June 77.50/80 Call Spread ($1.30) and sell the June 70 Put ($1.10).
Elsewhere look for Gold to resume its uptrend while Crude Oil may be reversing lower. The U.S. Dollar Index continues to mark time moving sideways in broad consolidation while U.S. Treasuries are at resistance as they move higher. The Shanghai Composite reopens with a positive outlook and Emerging Markets are pausing in their move higher.
Volatility looks to remain at low levels making it easier for equities to advance. Their charts show digestion of the 6-week move higher in the shorter timeframe as the SPY, IWM and QQQ all held over their 20-day SMA’s. The longer timeframe sees the uptrend intact but with some indecision in the short run. Use this information as you prepare for the coming week and trad’em well.
Disclaimer: The information in this blog post represents my own opinions and does not contain a recommendation for any particular security or investment. I or my affiliates may hold positions or other interests in securities mentioned in the Blog, please see my Disclaimer page for my full disclaimer.
