Here is your Bonus Idea with links to the full Top Ten:
Johnson & Johnson (NYSE:JNJ), $JNJ, fell from a top in January. A quick bounce in February saw it consolidate and drop again. The bounce to a lower high in April resulted in another pullback to a low in late May. But since then it has done well. A move up first to the April high into the beginning of August. Then a pullback to a higher low at the 20 day SMA and reversal, completed an Inverse Head and Shoulders pattern. This gives a target to at least 147, or near the January high.
The price action at the end of last week saw it reversing out of a short term consolidation after it closed a small gap from February. The RSI is rising and bullish with the MACD flat but positive. The Bollinger Bands® are shifted to the upside. There is resistance at 137 and 139 then 141.25 and 143.75 then 146.80 and 148.25. Support lower comes at 134 and 132.75 before 129.75 and 126.50. Short interest is low under 1%. The company is expected to report earnings next on October 16th. The stock pays a 2.65% dividend and it begins to trade ex-dividend on Monday, the 27th.
The August 31 Expiry options chain shows the biggest open interest this week at the 135 strike on both the call and put side. The September options also show big open interest at 135 but bigger at 140 on the call side and 130 on the put side. The October chain, covering the earnings report, shows open interest focused from 130 to 140 on the call side. But on the put side it is big from 120 to 130 and then again at 90.
Johnson & Johnson, Ticker: $JNJ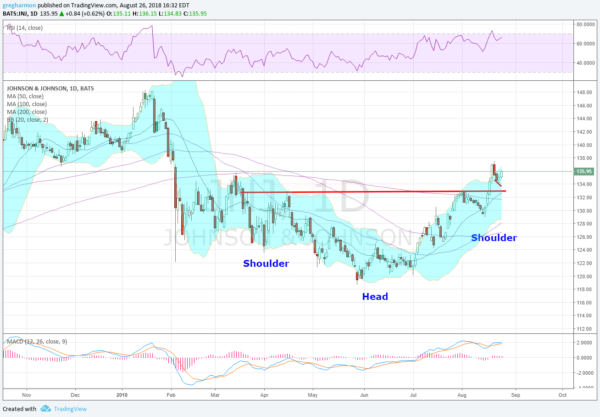
Trade Idea 1: Buy the stock on a move over 137 with a stop at 134.
Trade Idea 2: Buy the stock on a move over 137 and add a September 136/132 Put Spread ($1.50) for protection, while selling the September 140 Calls (40 cents) to cover some of the cost.
Trade Idea 3: Buy the September/October 140 Call Calendar (97 cents) and sell the September 130 Puts (45 cents) to lower the cost.
Trade Idea 4: Buy the October 130/140 bullish Risk Reversal (12 cents).
After reviewing over 1,000 charts, I have found some good setups for the week. These were selected and should be viewed in the context of the broad Market Macro picture reviewed Friday which as the summer winds down with the last week of August coming up sees the equity markets waking up and moving higher.
Elsewhere look for Gold to possibly bounce around in its downtrend while Crude Oil moves higher. The US Dollar Index is stalling in its uptrend while US Treasuries may be on the verge of breaking their consolidation to the upside. The Shanghai Composite continues to look weak and with an easier path lower while Emerging Markets are bouncing in their downtrend.
Volatility looks to remain at very low levels keeping the bias higher for the equity index ETF’s SPY (NYSE:SPY), IWM and QQQ. Their charts are aligned with that view. The shorter daily timeframe shows all 3 back in uptrends, with the QQQ the only one short of its all-time high level. The weekly charts all look fantastic as well and show lots of upside potential. Use this information as you prepare for the coming week and trad’em well.
The information in this blog post represents my own opinions and does not contain a recommendation for any particular security or investment. I or my affiliates may hold positions or other interests in securities mentioned in the Blog, please see my Disclaimer page for my full disclaimer.