Here is your Bonus Idea with links to the full Top Ten:
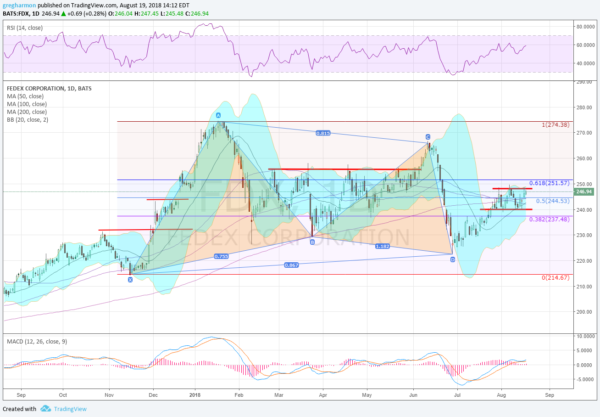
FedEx Corporation (NYSE:FDX), has bounced around in a broad price range since starting higher in November. Digging into the price action though there are a few meaningful aspects to the movement. First there is long consolidation from late February to the beginning of June under resistance at about 256. It touched the 200 day SMA during this period. The two peaks on either side of that combine to create a bullish Bat harmonic that triggered at the end of June. It has been moving higher since then but is currently stalled at a 50% retracement of the pattern and the confluence of the SMA’s. A push higher sees the next target over 252 at a full retracement to 274.
The RSI is rising in the bullish zone with the MACD turning back up and positive. The Bollinger Bands® had squeezed ad seem to be starting to open to the upside. There is resistance at 248.50 and 256 then 266.50 and 274.40. Support lower comes at 240 and 231 then 226. Short interest is low at 1.8%. The company is expected to report earnings on September 17th. The stock pays a dividend over just over 1% and starts to trade ex-dividend next on September 7th.
The August 31 Expiry options chain shows very high open interest at the 247.50 Call strike, with smaller size from 227.50 to 232.50 on the Put side. The September options, covering the earnings report, show an expected move of almost $13 between now and expiry, with the biggest open interest at the 230 and 240 Puts as well as the 250 Calls. October options show a pocket of open interest from 220 to 240 on the Put side and from 240 to 270 on the Call side.
Trade Idea 1: Buy the stock on a move over 248.50 with a stop at 240.
Trade Idea 2: Buy the stock on a move over 248.50 and add a September 245/230 Put Spread (about $4) selling an October 260 Call ($3.30) to fund most of the protection.
Trade Idea 3: Buy the August 31 Expiry/September 250 Call Calendar for $2.95.
Trade Idea 4: Buy the September 14 Expiry 245/250 Call Spread ($$2.70) and sell the September 14 Expiry 240 Put for 55 cents.
After reviewing over 1,000 charts, I have found some good setups for the week. These were selected and should be viewed in the context of the broad Market Macro picture reviewed Friday which with August options expiration over and back to school on its way sees the equity markets continuing to look strong on the longer timeframes.
Elsewhere look for Gold to continue lower while Crude Oil joins it heading to the downside. The US Dollar Index may pause in its uptrend while US Treasuries drift higher in broad consolidation. The Shanghai Composite and Emerging Markets are looking really weak as they print multi-year lows and continue lower.
Volatility looks to remain subdued keeping the bias higher for the equity index ETF’s SPY (NYSE:SPY), IWM and QQQ. Their charts are a bit mixed in the shorter timeframe with the QQQ pulling back, the IWM flat and the SPY running higher. But all three remain in solid uptrends on the longer basis. Use this information as you prepare for the coming week and trad’em well.
The information in this blog post represents my own opinions and does not contain a recommendation for any particular security or investment. I or my affiliates may hold positions or other interests in securities mentioned in the Blog, please see my Disclaimer page for my full disclaimer.

