Here is your Bonus Idea with links to the full Top Ten:
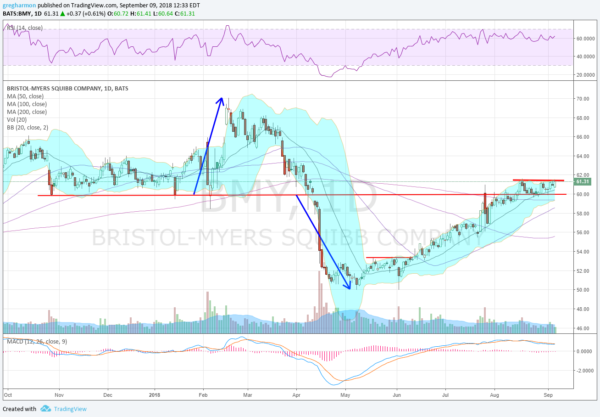
Bristol-Myers Squibb, $BMY, rose up off of support in February and made a top later that month. It pulled back, finding support eventually at a symmetrical move to the downside and bounced. Since then it has moved back higher and crossed over the prior support area. It is consolidating there with the Bollinger Bands® tightening, often a precursor to a move. The RSI is in the bullish zone, with the MACD flattening and positive.
There is resistance at 61.50 and 63.60 then 65.65 and 68 before 70. A Measured Move to the upside gives a target at 70. Support lower comes at 60 and 57.20 then 53.40 and 50. Short interest is low under 1%. The stock pays a dividend with a current yield of over 2.6%, and should not start to trade ex-dividend until early October. The company is expected to report earnings next on October 25th.
The September options chain shows the biggest open interest at the 60 strike with a strong showing as well at the 62.50 Calls and 57.50 Puts. In October it is the 62.50 strike with the biggest open interest. The October 26 Expiry chain, the first to include the earnings reporting date are just opening and have very little open interest. So you have to go the December options to see what earnings plays are being made. They show the majority of the open interest on the Call side and spread from 57.50 to 65.
Bristol-Myers Squibb, Ticker: $BMY
Trade Idea 1: Buy the stock on a move over 61.75 with a stop at 60.
Trade Idea 2: Buy the stock on a move over 61.75 and add an October 60 Put ($1.07) while selling a December 67.50 Call (69 cents) to help fund the protection.
Trade Idea 3: Buy the September/October 62.50 Call Calendar (59 cents).
Trade Idea 4: Buy the October 57.50/65 bullish Risk Reversal (6 cent credit).
After reviewing over 1,000 charts, I have found some good setups for the week. These were selected and should be viewed in the context of the broad Market Macro picture reviewed Friday which after closing the books on summer vacations with the short week, saw some profit taking in the equity markets, but they all remained with strong long term charts.
Elsewhere look for Gold to possibly pause in its downtrend while Crude Oil slowly drifts higher long term. The US Dollar Index is marking time sideways while US Treasuries are biased to continue lower. The Shanghai Composite and Emerging Markets did nothing to change their downside trends.
Volatility has crept higher and set up to slowly continue, keeping pressure on equity markets. The equity index ETF’s SPY (NYSE:SPY), iShares Russell 2000 (NYSE:IWM) and Invesco QQQ Trust Series 1 (NASDAQ:QQQ), all reacted with moves lower on the week. The QQQ was the hardest hit and then the small caps with the SPY down less than 1%. Use this information as you prepare for the coming week and trad’em well.
The information in this blog post represents my own opinions and does not contain a recommendation for any particular security or investment. I or my affiliates may hold positions or other interests in securities mentioned in the Blog, please see my Disclaimer page for my full disclaimer.
Which stock should you buy in your very next trade?
AI computing powers are changing the stock market. Investing.com's ProPicks AI includes 6 winning stock portfolios chosen by our advanced AI. In 2024 alone, ProPicks AI identified 2 stocks that surged over 150%, 4 additional stocks that leaped over 30%, and 3 more that climbed over 25%. Which stock will be the next to soar?
Unlock ProPicks AI