Here is your Bonus Idea with links to the full Top Ten:
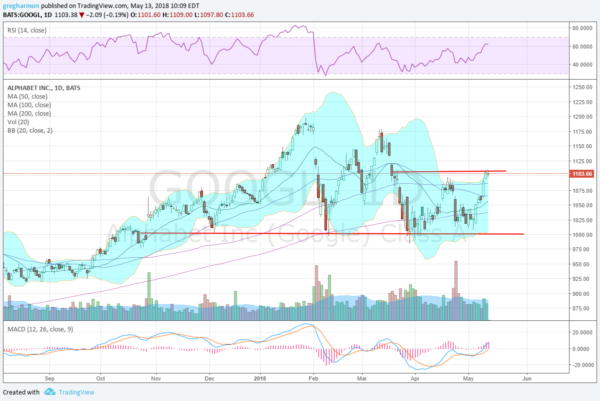
Alphabet (NASDAQ:GOOGL), $GOOGL, gapped up over 1000 at the end of October, starting a run that would take it nearly 20% higher by the end of January. It retraced that entire move in less than 2 weeks, closing the gap, and finding support at the 200 day SMA. Two steps higher closed all the gaps from the fall, but stopped short of the prior high. It then pulled back to 1000, finding support there again in late March and bounced. Over the last 6 weeks it has been stuck between 1000 and 1105 and enters the week at the top of that range.
The RSI is rising and making a higher high in the bullish zone while the MACD is also moving higher and positive. These support more upside. The Bollinger Bands® are also opening to the upside to allow a move. There is resistance at 1105 and a gap to fill to 1131.50 then resistance higher at 1175 and 1190 before it would make a new high at 1200. Support lower comes at 1089 and 1064 then 1050 and 1000, with a shift from consolidation to a downtrend under 1000. Short interest is low under 1%. The company is expected to report earnings on July 23rd.
Options chains show that the largest open interest is at the 1100 strike this week. In June the largest open interest is at the 1060 strike below. The July options show big open interest at the 1000 put and 1100 and 1140 call strikes. You have to look at the August options to get past the next earnings report. That chain shows large open interest at the 1200 call.
Alphabet, Ticker: $GOOGL

Trade Idea 1: Buy the stock on a move over 1105 with a stop at 1085.
Trade Idea 2: Buy the stock on a move over 1105 and add a June 1100/1060 Put Spread ($13.50) while also selling the July 1200 Call ($8.60).
Trade Idea 3: Buy the July 1120/1170/1200 broken wing Call Butterfly (12.80) and sell the July 1000 Put ($7.20).
Trade Idea 4: Buy the June/August 1150 Call Calendar ($24.90) and sell the July 1000 Put ($7.20). Continue to sell shorter dated calls as the June calls expire with a goal of owning the August calls outright with a basis near or below zero cost.
After reviewing over 1,000 charts, I have found some good setups for the week. This week’s list contains the first five below to get you started early. These were selected and should be viewed in the context of the broad Market Macro picture reviewed Friday which heading into May options expiration week saw the equity markets have regained some swagger short term, but remain consolidating below all-time highs.
Elsewhere look for Gold to continue its short term bounce off of the bottom of a range while Crude Oil continues to move higher. The US Dollar Index may be ending its short term bounce while US Treasuries consolidate at recent lows. The Shanghai Composite is bouncing off of support but Emerging Markets continue to build a bull flag off of their January high.
Volatility looks to continue to drift lower towards very low levels keeping the bias higher for the equity index ETF’s SPY (NYSE:SPY), IWM and QQQ. Their charts all confirmed short term uptrends this week, making higher highs following higher lows, and look set to continue. Longer term they still have work to do to resume the uptrend, with the IWM on the verge of that confirmation and the QQQ and SPY trailing behind. Use this information as you prepare for the coming week and trad’em well.
The information in this blog post represents my own opinions and does not contain a recommendation for any particular security or investment. I or my affiliates may hold positions or other interests in securities mentioned in the Blog, please see my Disclaimer page for my full disclaimer.
