Here is your Bonus Idea with links to the full Top Ten:
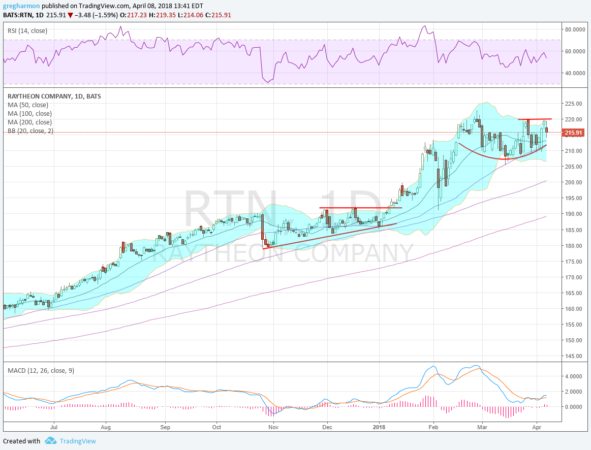
The uptrend in Raytheon Company (NYSE:RTN), started in 2011 and has continued for 7 years with only a few pauses. It is experiencing one of those pauses now as it has consolidated sideways over the last 7 weeks. Most recently it has been riding over support at the 50 day SMA and pressing against resistance. A push over resistance would give a target to 235. A break down under support could move a long way lower given the time it has gone without a major pullback.
The RSI is holding in the bullish zone over the mid line with the MACD crossing up and positive. These support a move higher. The Bollinger Bands® have squeezed, which could mean the timing is right for the stock price to move now. There is no resistance over 220. Support lower sits at 208 and 200 then 195 and 191.65 before 185 and 182.60. Short interest is low at 1.5%. The company is expected to report earnings next April 26th and the stock begins to trade ex-dividend on Tuesday April 10th.
The April options chain shows greater open interest on the call side and sitting at the 220 and 230 strikes. The put side is biggest at 200 then 210. In the May options, the first expiry beyond the earnings report, open interest is also much bigger on the call side. Here it is biggest at 220 and then 230. On the put side it is biggest at 210 and then smaller and stretched to 175. August options also favor the call side at the 220 and 230 strikes.
Trade Idea 1: Buy the stock on a move over 220 with a stop at 210.
Trade Idea 2: Buy the stock on a move over 220 and add a May 210/200 Put Spread ($2.75) while selling a May 230 Call ($2.05 credit).
Trade Idea 3: Buy a May 200/220/230 Call Spread Risk Reversal (90 cents).
Trade Idea 4: Buy an April/May 220 Call Calendar ($3.25) and sell the April 200 Put (65 cents). Consider also selling a May 200 Put after the April Put expires.
After reviewing over 1,000 charts, I have found some good setups for the week. These were selected and should be viewed in the context of the broad Market Macro picture reviewed Friday which as we head into the new week sees the equity markets continuing to hold onto long term uptrends, consolidating in broader ranges. They also printed nearly identical weeks, ending lower.
Elsewhere look for Gold to continue to consolidate in a broad range while Crude Oil consolidates with a bias lower. The US Dollar Index looks to mark time sideways while US Treasuries consolidate with a bias higher. The Shanghai Composite returns after a short week stuck in a range at the February lows while Emerging Markets continue to build a bull flag at the highs. Volatility looks to remain elevated creating a headwind for the equity index ETF’s SPY (NYSE:SPY), iShares Russell 2000 (NYSE:IWM) and PowerShares QQQ Trust Series 1 (NASDAQ:QQQ). Their charts show broad consolidation after the recent pullback with the QQQ at greatest risk of a move lower. Use this information as you prepare for the coming week and trad’em well.
The information in this blog post represents my own opinions and does not contain a recommendation for any particular security or investment. I or my affiliates may hold positions or other interests in securities mentioned in the Blog, please see my Disclaimer page for my full disclaimer.

