by Clement Thibault
Alphabet Inc (NASDAQ:GOOGL), the holding company which manages and operates Google, is set to report Q3 2016 earnings on Thursday, October 27th, after the closing bell.

1. Earnings and Revenue
Alphabet is expected to report earnings of $8.63 per share, along with $22.04 billion in revenue. Google has been on a roll through 2016, posting YoY revenue growth of 17% in Q1 and 21% in Q2. It's no surprise then that expectations continue to be high for Alphabet, with expected 17% growth in Q3 as well.
2. Advertising
While Alphabet is the official holding company, 99% of its revenue continues to come from its Google segments with the remaining 1% derived from its Other Bets division (discussed below). Last quarter, of the $21.5 billion in revenue the company reported, $21.3 billion came from Google businesses. The leading revenue producer—by far—has been advertising, which brought in $19.1 billion.
Because it's the predominant search engine, as well as the owner of the popular video website YouTube, Google is incredibly well positioned to continue taking advantage of the growth in internet advertising. Consulting firm PWC expects internet advertising revenue to surpass TV advertising revenue in 2016, and to grow at an 11.1% CAGR, reaching $260 billion by 2020.
PWC divides internet revenue into three segments—video, paid searches, and others. Google is the leader in two of the three segments, video and paid searches via YouTube and its search engine, so it's set up to continue to reap the benefits its dominance provides.
The metrics Alphabet furnishes regarding its advertising revenue are aggregate paid clicks and cost-per-click. The first measure represents the total amount of clicks received per ad while the second indicates the revenue derived per click on an ad.
Google's amount of clicks grew by 29% last quarter though the revenue per clicks dropped 7%, mainly because of increased clicks coming from developing countries, where a click is sold at significantly cheaper rates. According to Wordstream, an Indian click costs 77% less than a US click. Overall and longer term, Alphabet will benefit from developing markets countries even with lower rates; as the countries' development accelerates, so too will the revenue from each click.
Mobile advertising is another area in which Google is well positioned because of its Android mobile operating system. Mobile devices equipped with Android come with just about everything Google—Google Search, Google News, Google Play, and many additional Google applications, providing the company with enormous reach and unlimited potential in the mobile arena.
3. Other Bets
Alphabet's Other Bets division is the catch-all for all developmental projects the company operates, such as Google Fiber, a provider of extremely fast internet service; Nest, Google's smart home hardware company; and Verily, Google's R&D organization researching life sciences. Other Bets' revenue derives primarily from these three ventures, and revenue grew 250% year-over-year, to $185 million this year. Ambitious ventures provide glamorous headlines and an aura of innovation, but they are also a tremendous cash burn. Alphabet is losing a couple of billion dollars each year by funding such projects, but it also demonstrates that Alphabet is serious about not resting on its already well-established laurels.
Conclusion
Alphabet is in good shape today, and appears to be set up to maintain its competitive advantages for years to come, whether that's through its Google search engine, YouTube, or Android, which remains the leading mobile operating system in the world today.
Valuation measures tell a similar story: GOOGL's price-to-free-cash-flow ratio is 28.93 per share, which isn't insignificant, but provides investors with much more value per share than Facebook (NASDAQ:FB), which currently has a price-to-free-cash-flow ratio of over 50. Similarly, its P/E ratio, which at 30.8 is hardly low. However, if you take into account the S&P 500's average P/E ratio is now 24.6, there's no reason to shy away from Alphabet's growth prospects.
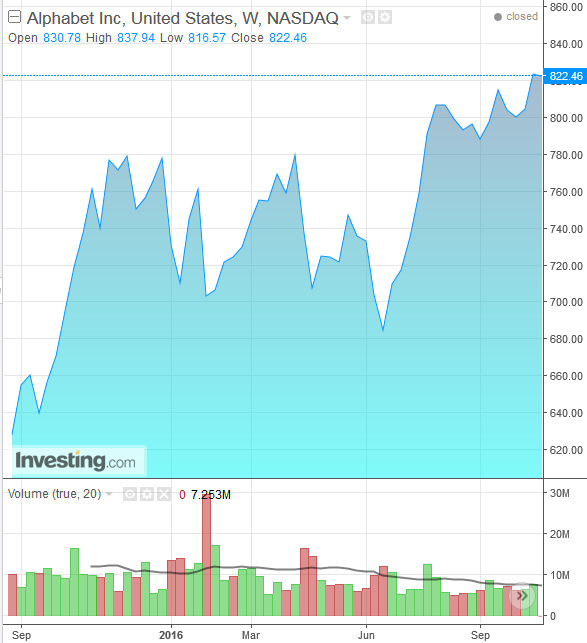
As for the company's cost per share, $822.46 as of yesterday's close, yes, it's pricey on an absolute scale. However, it's relatively cheap compared to other technology companies when growth potential is taken into account. For instance, it's cheaper than Twitter, Yahoo (NASDAQ:YHOO) or Salesforce. Google's unique position makes it difficult to compare it to other companies, but according to industry data, the average P/E for the internet content & information sub-sector is 33 while Price-to-FCF is 38.8, so GOOGL comes in below those numbers as well.
Stock ownership today often requires accepting that the absolute cost of stocks is high. If you already accepted that premise then you should own Google.
