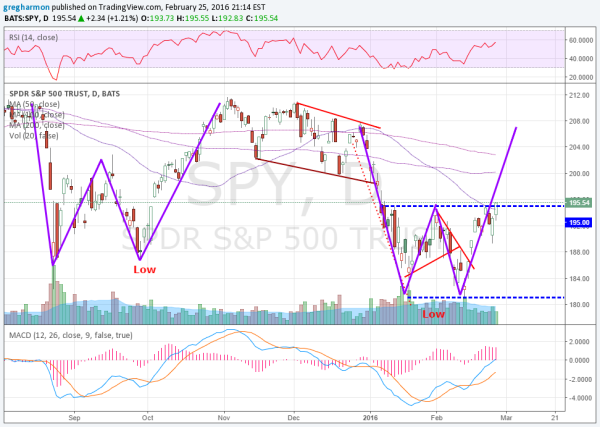
So far, 2016 has been a horrible year for stocks. Equities are off too much, oil keeps falling and bond yields are crashing. It seemed like there might be a reversal back at the end of January but that petered out. Yet with just two days left in February the markets have pulled out of a double bottom and are cracking that early January resistance. This thing is about to get real.
The chart below is giving 4 signs that the latest leg higher in the S&P 500 (N:SPY) may have a lot of room left to run. The first is the break of that dotted resistance line on Thursday. Which is a key to another sign -- the “W”. You can see how the last “W” played out from August to November. This one, though, is tighter and looks to play out to about 207.50 over the next two weeks.

The move Thursday also took SPY over its 20-day SMA for the first time this year. Momentum is with the markets. The RSI is on the verge of a move into the bullish zone while the MACD is about to turn positive. Both are rising and support more upside price action.
SPY could certainly fall back again and fizzle out. But Thursday's move was significant.
