Right now, there are 2 fears giving first-level investors night terrors (and costing them huge gains and income).
- Rising interest rates will kill stocks, and…
- Nosebleed valuations (along with more record highs for the S&P 500) will kill stocks.
The problem? Both are nonsense!
Let’s take the second one first—then we’ll push on to 4 buys that not only survive rising rates but soar faster than rates do!
A Painful Wait on the Sidelines
Sure, the market’s current P/E ratio looks scary at around 23, and that alone could keep you clear of stocks now. Trouble is, sitting in cash isn’t exactly comforting as stocks rise and inflation chews up your nest egg.
Worse, there’s no reason to sit this market out—the truth is, stocks are already cheap and getting cheaper.
Don’t believe me?
Take it from my colleague, closed-end fund “professor” Michael Foster, who pointed out last week that the P/E ratio most folks look at is backward looking: the “E” is based on the last 12 months of earnings.
That ignores soaring corporate profits (pegged for a 23% rise in 2018). When we base our ratio on projected profits, we see that stocks are only priced at 17.3 times earnings—as Foster says, well below the level of 20 generally seen as the tipping point—and going lower.
Earnings Outrace Share Prices—and Deliver an Opportunity
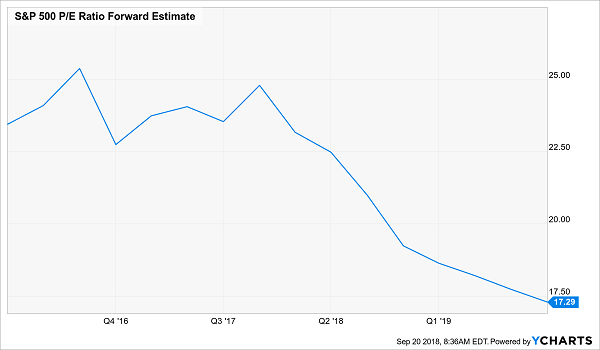
So ignore the braying about so-called “nosebleed” P/Es—now is the time to buy. (And you know me: I’ve got 4 high yielders—7% dividends, on average—ready to go for you a little further down).
But if you’re still feeling shaky about the other elephant in the room: the worry that rising rates will kill stocks (especially dividend stocks), let me take that on now.
The Rising-Rate Lie
If you’re one of the many folks who still worry about stocks wilting as rates rise, take a look at this:
Rate Terror Crushed in 1 Chart
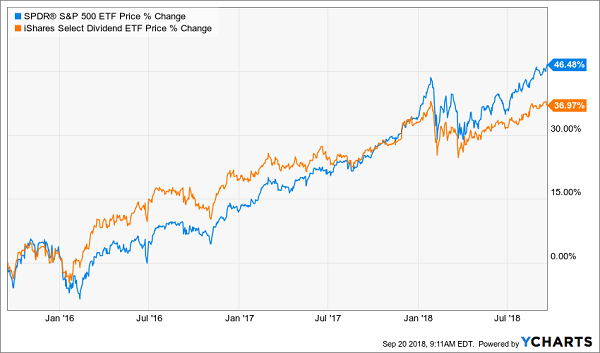
We’re looking at the price returns of the benchmark SPDR S&P 500 ETF (NYSE:SPY) and the iShares Select Dividend ETF (DVY). DVY is a solid indicator for dividend stocks, paying a 3.1% yield, nearly double what your average S&P stock does.
As you can see, investors in both ETFs grabbed gains upwards of 37% since December 2015, when the current rising-rate cycle kicked off. That’s not bad! And it already sends our “rates-up, stocks-down” myth packing.
But yes, it’s also true that the market did outperform high yielders, and not by a little—about 11 points.
The thing is, the above chart only tells half the story. When you add in dividends—which most folks never do—that gap all but vanishes:
Dividends Deliver Gains and Safety
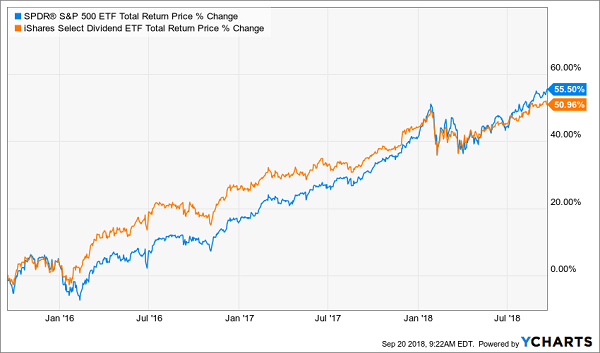
The 4.5-point margin you see above is a tiny price to pay for the extra security dividends give you. Because consider this: our DVY holders got 27.5% of their profit in safe cash—not here-today-gone-tomorrow paper gains. SPY holders? Only 16.3% of their profit came as dividends.
And look again at the chart above. DVY led SPY for the vast majority of this period; it’s only a matter of time before it does so again.
I don’t know about you, but I know where I’d rather put my money—and it’s not in your average S&P 500 name.
Some High Yielders Are Still Deadly Traps
But we do have to be careful here; just because DVY flourished as rates rose doesn’t mean all high yielders will.
You particularly want to stay well clear of “bond proxies” like Campbell Soup (CPB), which has erased 16% of shareholders’ wealth since December 2015. This at a time when the broader market returned 56%!
Consumer Staples: the Walking Dead
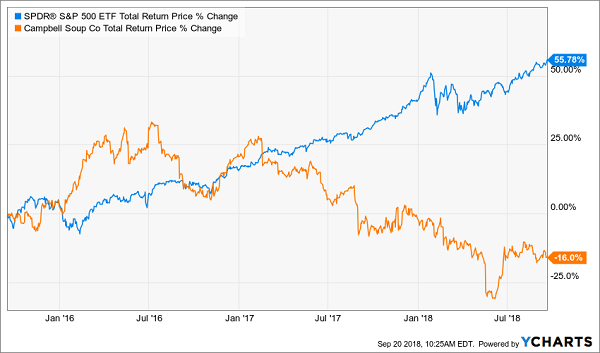
There are many reasons for this flameout, including that CPB and many other food makers simply can’t get their heads around the shift to fresh over packaged fare.
But here’s an even more important reason: why would you risk a 16%+ price drop for a 3.4% dividend when you can get nearly that (3.05% as I write) from 10-Year Treasuries and have your principal guaranteed?
It makes no sense—and the market knows it.
This sad tale also tells us something else: to really profit as rates rise, we need stocks whose dividends “outrun” the yield on the 10-year, either through high current yields or explosive dividend growth, like the surging payouts paid by the companies I revealed in “10 Dividend Stocks That Will Double Your Money.”
Which brings me to the 4-fund high-yield “mini-portfolio” I’ll show you now.
4 Dividends Up to 9.7% That LOVE Rising Rates
A simple way to amp up your portfolio’s yield is to swap out your blue chips for closed-end funds (CEFs), many of which own the same stocks but with one key difference: these often-ignored funds pay massive dividends!
You can see this in the 4 CEF picks I have for you today. I could go on and on about them, but I’ll draw your attention to 3 crucial boxes these 3 funds tick off: high yields (a 7% average dividend), discount pricing and low volatility.
Let’s start with yields.
“Swap Out” Your Blue Chips for These Amazing Payouts

There are a few things I want to bring to your attention here.
For one, you can see that our first pick, the Gabelli Dividend & Income Trust (GDV) is the lowest yielder of our 4-fund “mini-portfolio,” but its payout still triples the market’s pathetic 1.7% average!
GDV’s portfolio is stuffed with stocks you likely already own, like JPMorgan Chase (NYSE:JPM), American Express (NYSE:AXP) and Verizon (NYSE:VZ). Plus you get the expertise of value-investing phenom Mario Gabelli to power that outsized 5.5% payout.
Next, the John Hancock Equity & Income Fund (NYSE:HEQ) boasts similar holdings—names like Qualcomm (NASDAQ:QCOM), Intel (NASDAQ:INTC) and Philip Morris International (NYSE:PM)—plus us a steady, outsized 9.7% payout and a history of dividend growth.
Bankroll Your Retirement With HEQ
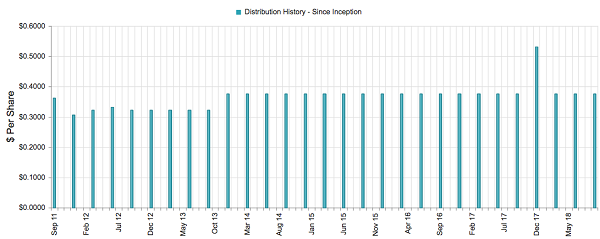
By the way, if you’re worried about volatility, HEQ is the fund to own. Its two-person management team (with 58 years of experience between them) uses a proven options strategy to cushion your cash in a downturn.
That shows up in HEQ’s “beta” rating—a key measure of volatility. Right now, the fund’s five-year beta clocks in at 0.59. (Any rating below 1 is less volatile than the market.)
BDJ, too, boasts a low beta of 0.77, helping offset GDV’s slightly higher 1.3. And each of our first 3 funds trade around 4% below net asset value (NAV), so we can enjoy these gaudy cash payouts without worrying that we’ve overpaid.
Our 4th Pick Boosts Adds Safety and Gains
Speaking of beta, our fourth pick, the Invesco Dynamic Credit Opportunities Fund (VTA), holds a slight negative rating (-0.18), meaning it occasionally likes to run counter to the market, giving our 4-fund portfolio a touch of extra ballast.
That’s because this fund holds floating-rate loans, rather than stocks, and the rates on these loans tick higher with a benchmark like LIBOR (which is used for many corporate loans). And LIBOR has taken off with rates generally:
Borrowers Pay Up
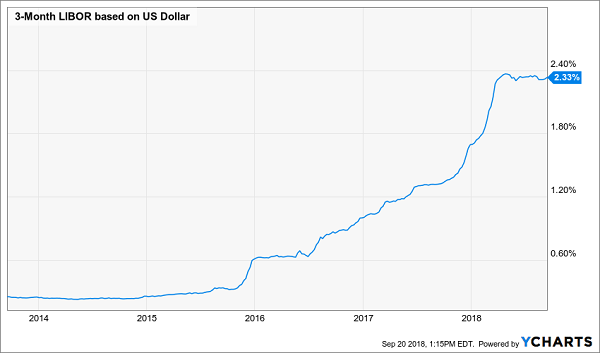
Where does that leave VTA? With a 6.5% dividend and an outsized 13.2% discount to NAV, this is hands-down one of the best rising-rate plays out there now.
Revealed: My Personal “Rising Rate” Portfolio—8%+ Dividends Paid Monthly
Here’s something else you’ll love about CEFs: many (including VTA, GDV and BDJ) not only boast outsized cash dividend payouts, but they pay them monthly instead of quarterly!
So if you hold these funds in your retirement portfolio, your dividends will roll in on exactly the same schedule as your bills!
Convenience isn’t the only reason to love monthly payers. Because they also let you reinvest your payouts faster, amplifying your gains (and income stream) as you do.
The best news?
I’ve built an entire portfolio for you that not only pays dividends monthly but boasts a higher average dividend (8.0%, to be exact) than the 7% average paid by the 4 CEFs I just showed you.
And with just a single click, you can kick-start your 8.0% monthly income stream TODAY.
“Outrun” Rising Rates With These 8%+ Payers
My new “8% Monthly Dividend Portfolio” is a tightly built collection of real estate investment trusts (REITs), CEFs and dividend-growth stocks I’ve personally assembled to protect and grow your portfolio, no matter what happens with the Federal Reserve or in DC.
And yes, as the name suggests, this portfolio also hands you a tidy 8% in dividend income, year in and year out.
So a $500k nest egg would haul in $40,000 a year—enough for many folks to retire on! (And the yield on your initial buy will climb as each of the stout investments in my “8% Monthly Dividend Portfolio” hike their dividends).
And because these cash machines pay dividends monthly, you can look forward to a steady $3,333 in income, month in and month out—give or take a couple hundred bucks.
I’d love to share the names of all my favorite monthly payers with you now. Simply click here and I’ll give you my full research on these monthly dividend all-stars—names ticker symbols, buy-under prices, the works. Don’t miss out!
Disclosure: Brett Owens and Michael Foster are contrarian income investors who look for undervalued stocks/funds across the U.S. markets.
