Classifying stocks as either growth or value is one of the oldest and most studied fundamental investment pillars. This process traditionally involves the analysis of various balance sheet statistics to determine a company’s intrinsic net worth relative to its peers and historical benchmarks.
Being that “value” is such a sought-after characteristic, it’s no surprise that over 50 exchange-traded funds are dedicated to the pursuit. The largest of which include the iShares Russell 1000 Value (NYSE:IWD) and the Vanguard Value (NYSE:VTV).
Both funds offer a highly diverse pool of stocks culled from well-known indexes with extremely low fees. If there is a criticism to be made of these ETFs, it’s that they are possibly too diverse and constructed using overly simplistic methods. This may fail to resonate with investors who truly worship at the altar of fundamental analysis.
Value purists may ultimately scoff at the likes of VTV and IVE in favor of deeper analysis and a smaller pool of stocks with the capability to show off what this factor is all about. Fortunately, there are several ETFs that bring the true spirit of value investing back to its roots.
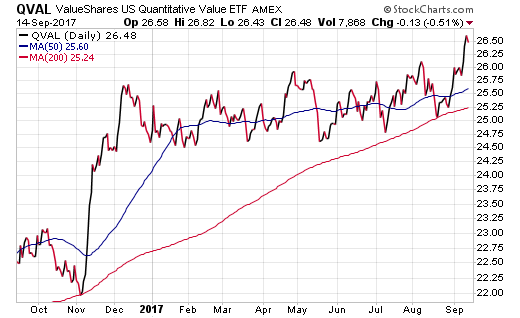
ValueShares US Quantitative Value (NYSE:QVAL)
QVAL is the flagship fund of Alpha Architect, an independent ETF sponsor created by Wesley Gray PhD and Jack Vogel PhD. Both gentlemen have forgotten more about fundamental value characteristics than I will ever be able to remember. As such, they are a perfect team to construct a quantitatively driven portfolio of stocks by identifying attractive fundamental criteria.
QVAL is an index-based ETF with just 40 holdings that are roughly equal weighted in the portfolio structure. This allows for each stock to have a similar contribution to the total return of the fund rather than giving larger companies the lion’s share of the assets.

To be included in the QVAL portfolio, stocks must meet forensic accounting, valuation, and quality screens to ensure minimum requirements are met. Well-known holdings include: General Motors Corp (NYSE:GM), Lear Corporation (NYSE:LEA), and Target Corp (NYSE:TGT).
This ETF is on the eve of celebrating its third birthday and charges an expense ratio of 0.79% for ongoing management of the strategy. It’s also notable that QVAL shares a similar philosophy with its foreign stock equivalent in the ValueShares International Quantitative Value (NYSE:IVAL) as well.
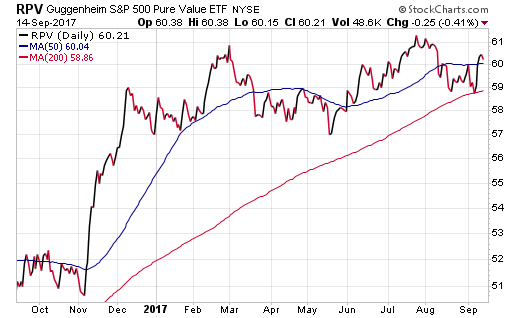
Guggenheim Invest S&P 500 Pure Value (NYSE:RPV)
Any fund with the phrase “pure value” in its title is tailor-made for this list. RPV is an index-based ETF that owns around 100 value stocks culled from the broader S&P 500 Index. What makes this fund unique is that it puts a more stringent valuation screen to the broader universe to rule out blended or ambiguous style approaches.
Another feature of the RPV portfolio is that it weights holdings according to the highest value scores. This creates a stronger influence of larger and more stable companies such as Berkshire Hathaway (NYSE:BRKa) Inc (BRK/B) and Centene Corp (CNC).

RPV has been in existence for over a decade now and has accumulated nearly $900 million in assets. The fund also charges a very reasonable expense ratio of 0.35%.
This type of fund may appeal to value enthusiasts as either a core holding or a tactical position to strategically target fundamental criteria. This same overarching theme is available in both small and mid-cap flavors as well via the Guggenheim Invest S&P SmallCap 600 Pure Value (NYSE:RZV) and Guggenheim Invest S&P MidCap 400 Pure Value (NYSE:RFV).
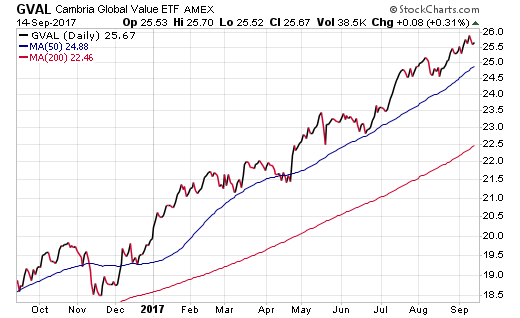
Cambria Global Value (NYSE:GVAL)
GVAL is a far different type of index fund, with a high degree of emphasis on foreign holdings. The fund has quickly grown to one of the largest in the Cambria stable by selecting stocks showing strong value characteristics across a universe of 45 countries. This includes both developed and emerging market exposure to provide a truly global exposure profile.
The fund currently holds just over 140 stocks with a high degree of concentration in Austria, Portugal, Russia, and Greece according to the recent fact sheet. This list is loaded with countries that experienced difficult periods in recent years and have recently become popular with the strong trend in emerging market equities.

The GVAL screening criteria is such that it will often weight out-of-favor stocks with attractive fundamentals given the expectation of stronger future returns. This can potentially lead to above-average volatility, but also a unique return profile that may fit well as a slice of international stock exposure.
GVAL carries an expense ratio of 0.69% and pays quarterly dividends to its shareholders.
Disclosure : FMD Capital Management, its executives, and/or its clients June hold positions in the ETFs, mutual funds or any investment asset mentioned in this article. The commentary does not constitute individualized investment advice. The opinions offered herein are not personalized recommendations to buy, sell or hold securities.
