Another View On The Inflation Argument
There is little evidence that current levels of inflation are stable. As I wrote in “Inflation: The Good & The Bad”, outside of just two areas, rent and health care, there remains a broader deflationary trend currently.
Importantly, as I noted, there are two types of inflation:
“Inflationary pressures can be representative of expanding economic strength if it is reflected in the stronger pricing of both imports and exports. Such increases in prices would suggest stronger consumptive demand, which is 2/3rds of economic growth, and increases in wages allowing for absorption of higher prices.
That would be the good.
The bad would be inflationary pressures in areas which are direct expenses to the household. Such increases curtail consumptive demand, which negatively impacts pricing pressure, by diverting consumer cash flows into non-productive goods or services.”
There is another way to view whether the “good” inflation is manifesting itself within the economy. The chart below shows the three major components that input into creating economically viable inflation – commodity prices (which reflects real economic activity,) wages (which allow for increases in spending and support for higher prices,) and the Velocity Of Money (which shows the demand for money through the economic system.)
When we combined these three components into a composite inflation index, and compare it to CPI, we find an important outcome.
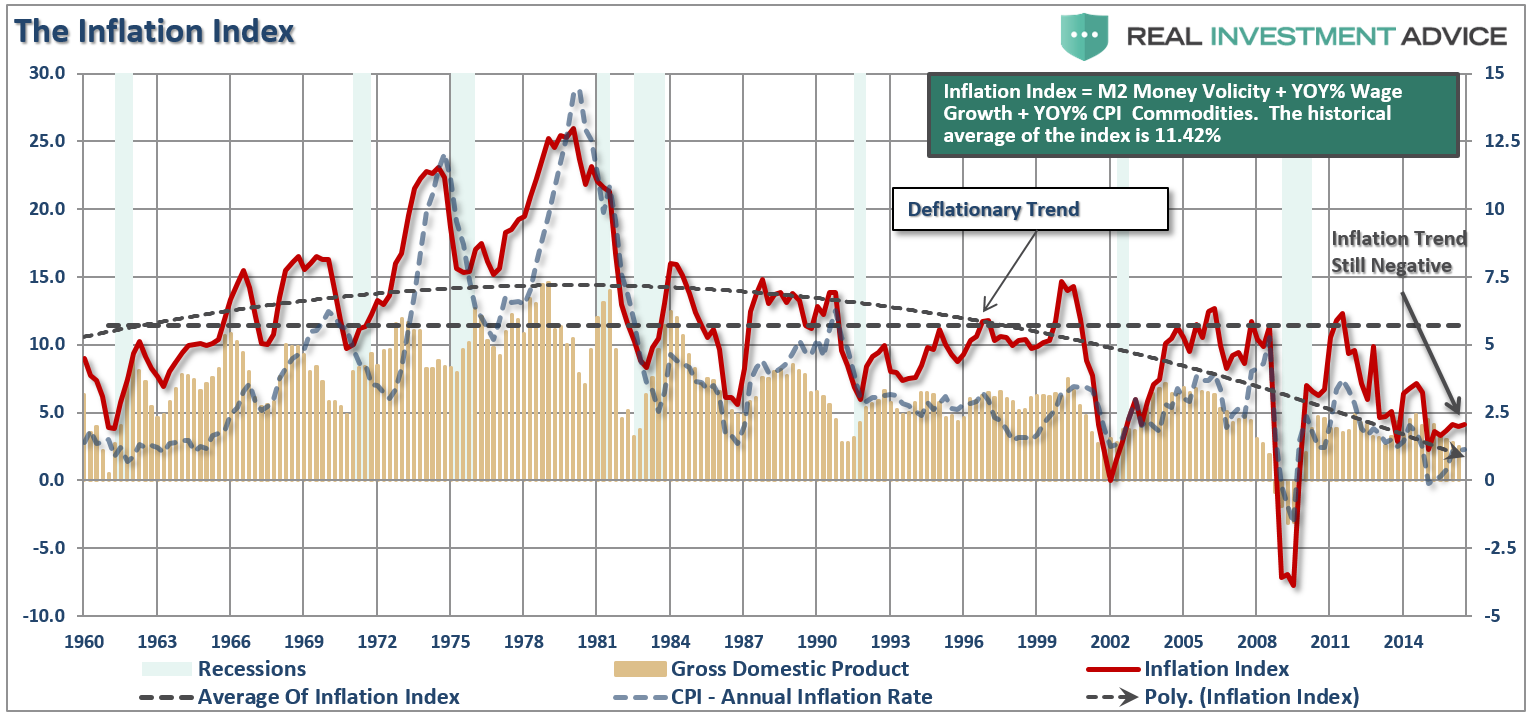
Currently, there are relatively few “real” inflationary pressures in the economy particularly as monetary velocity continues to plummet. It is also notable that both CPI and the inflation index remain below 2.5% even as interest rates push that level. Ultimately, either inflation will rear its head, or rates will drop back in line with the historic norms of real inflation levels and economic growth.
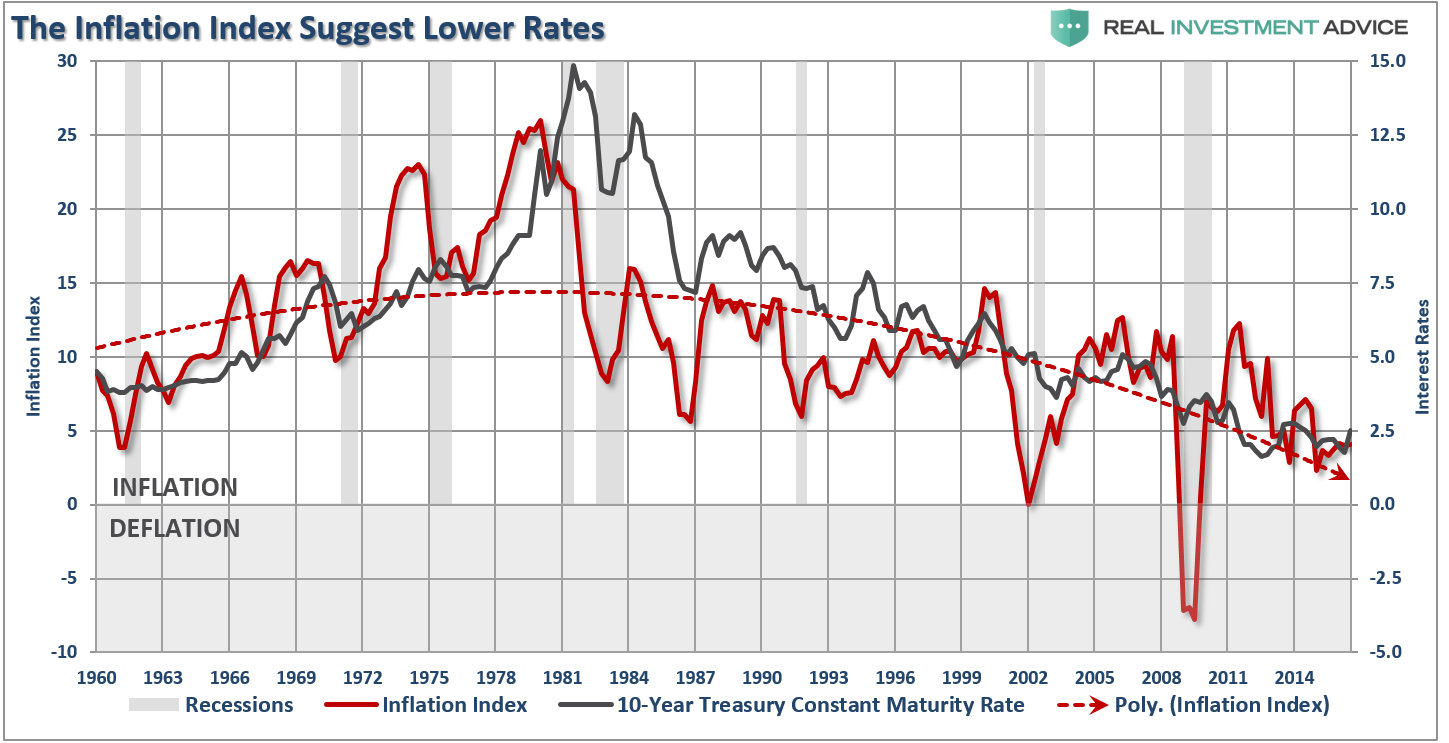
There is little argument over the fact that the current economic growth rate has been “sluggish” at best. Growth in the financial markets has been primarily a function of the Federal Reserve’s ongoing balance sheet expansion as economic activity remains fairly subdued. With the Federal Reserve now increasing interest rates over concerns about rising inflationary pressures, the Fed may once again be making the same mistake as they did in 1999. To wit:
“If this market rally seems eerily familiar, it’s because it is. If fact, the backdrop of the rally reminds me much of what was happening in 1999.
1999
- Fed was hiking rates as worries about inflationary pressures were present.
- Economic growth was improving
- Interest and inflation were rising
- Earnings were rising through the use of “new metrics,” share buybacks and an M&A spree. (Who can forget the market greats of Enron, Worldcom & Global Crossing)
- The stock market was beginning to go parabolic as exuberance exploded in a “can’t lose market.”
If you were around then, you will remember.
With Yellen, and the Fed, once again chasing an imaginary inflation ‘boogeyman’ (inflation is currently lower than any pre-recessionary period since the 1970’s) the tightening of monetary policy, with already weak economic growth, may once again prove problematic.”
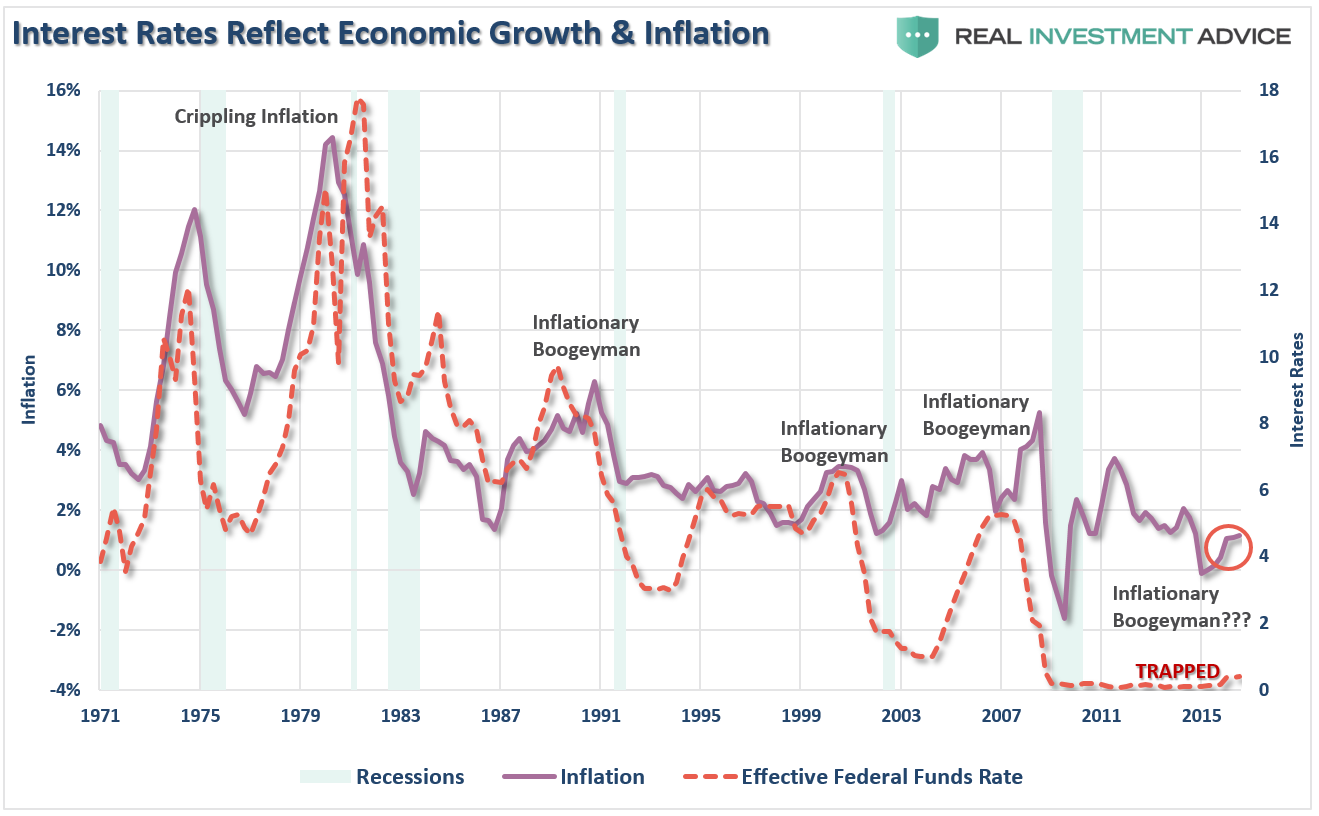
The biggest fear of the Federal Reserve has been the deflationary pressures that have continued to depress the domestic economy. Despite the trillions of dollars of interventions by the Fed, the only real accomplishment has been keeping the economy from slipping back into an outright recession.
Despite many claims to the contrary, the global economy is far from healed which explains the need for ongoing global central bank interventions. However, even these interventions seem to be having a diminished rate of return in spurring real economic activity despite the inflation of asset prices.
What is being realized on a global basis is that injecting the system with liquidity that flows into asset prices, does not create organic economic demand. Both Japan and the Eurozone’s interventions have failed to spark inflationary pressures as the massive debt burden’s carried by these countries continues to sap the ability to stimulate real growth. The U.S. is facing the same pressures as continued stimulative measures have only succeeded in widening the wealth gap but failed to spark inflation or higher levels of economic prosperity for 90% of Americans.
With inflationary pressures impacting the areas that specifically target consumptive spending, there is a real risk of a monetary policy mistake as the Fed once again chases an “inflation boogeyman.”
Stock/Bond Ratio Confirms Breakout
Following the October swoon, stocks have vaulted to all-time highs following the election of President Trump with the Dow recently breaking above the magical 20,000 level.
As I discussed previously in “Danger Lurks As Extremes Become The Norm” there have only been few occasions where investors have felt so “giddy” about the financial markets. Such periods of exuberance have never ended well for investors as they were deluded by near-term “greed” which blinded them to the building risks.
“Surprisingly, investors are currently more exuberant than just about at any other time on record.”
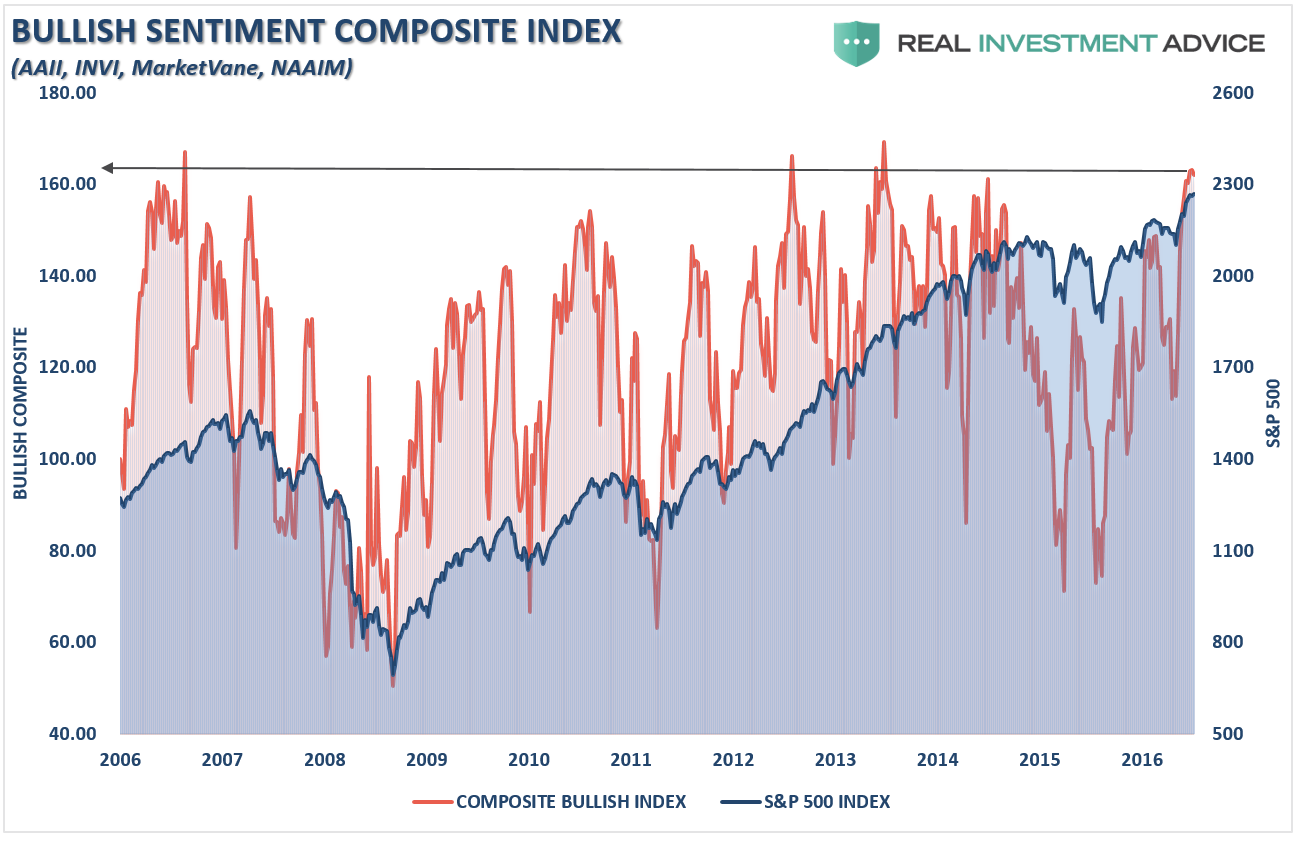
One of the things that I pay close attention to is the ratio of the S&P 500 compared to longer duration bonds. The theory is that when investors are willing to take on more risk, money flows out of “safe haven” like bonds to equities as portfolio allocations become more aggressively tilted. The opposite occurs as investors began to reduce “risk exposure” in portfolios and focus more on “safety.”
As you can see in the chart below, there is a very high level of correlation between the rise and fall of the stock/bond ratio and the very broad Wilshire 5000 Total Market Full Cap index.
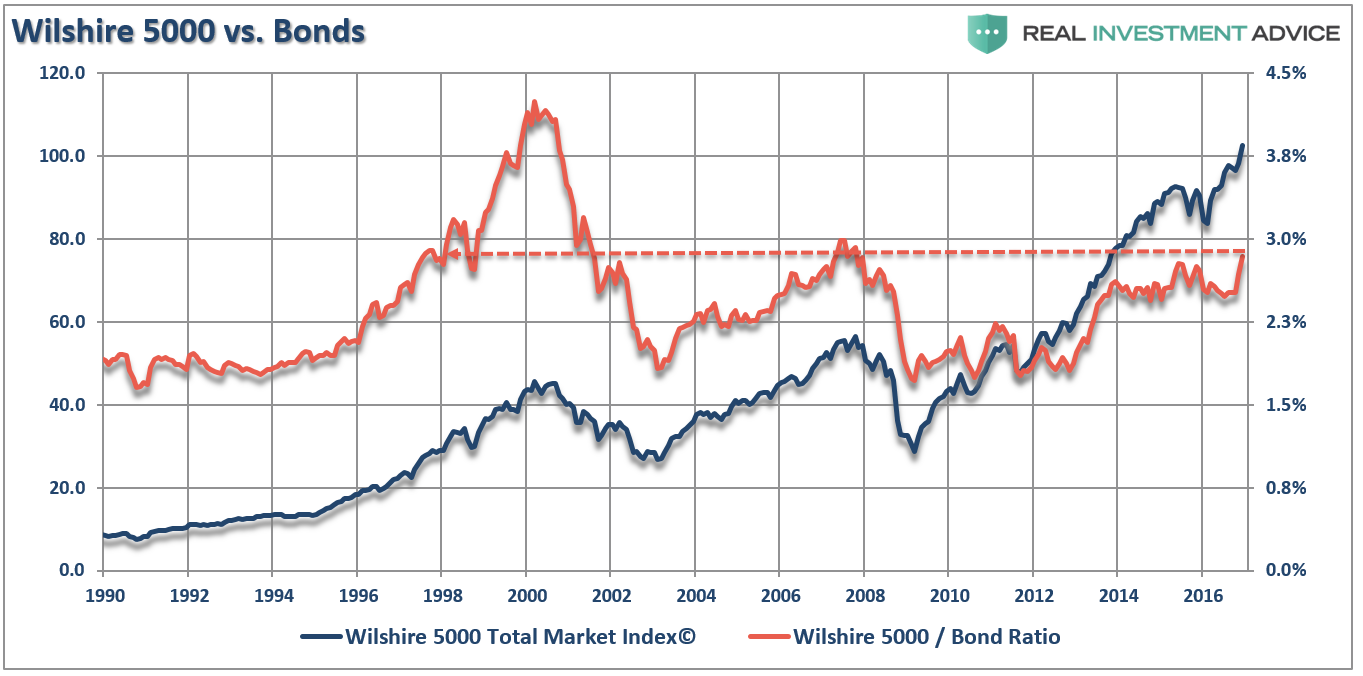
Since the Fed began extracting liquidity from the markets, beginning with the end of QE 3 and now the hiking of interest rates, the stock-bond ratio deviated from its normal correlation. However, post the election in November, that correlation has now rejoined the market as exuberance thrives and the ratio is pushing higher extremes.
Of course, with seemingly everyone in the “bullish camp,” and a good degree of history forgotten, Bob Farrell’s rule #9 comes to mind:
“When everyone agrees; something else is bound to happen.”
With the markets hitting all-time highs, this is an event that has only occurred during very short periods of our long market history. Of course, this only makes sense that when considering that the market spends the majority of its time making up previous losses. As my father often told me:
“Breaking even is not an investment strategy.”
But for now – it’s “Party On, Garth.”
Everyone’s A Genius
The last point brings me to something Michael Sincere’s once penned:
“At market tops, it is common to see what I call the ‘high-five effect’ — that is, investors giving high-fives to each other because they are making so much paper money. It is happening now. I am also suspicious when amateurs come out of the woodwork to insult other investors.”
Michael’s point is very apropos, particularly today. It is interesting that prior to the election the majority of analysts, media and investors were “certain” the market would crash if Trump was elected. Since the election, it’s “high-fives and pats on the back.”
While nothing has changed, the confidence of individuals and investors has surged. Of course, as the markets continue their relentless rise, investors begin to feel “bullet proof” as investment success breeds over-confidence.
The reality is that strongly rising asset prices, particularly when driven by emotional exuberance, “hides” investment mistakes in the short term. Poor, or deteriorating, fundamentals, excessive valuations and/or rising credit risk is often ignored as prices increase. Unfortunately, it is only after the damage is done that the realization of those “risks” occurs.
As Michael stated:
“Most investors believe the Fed will protect their investments from any and all harm, but that cannot go on forever. When the Fed attempts to extricate itself from the market one day, that is when the music stops, and the blame game begins.”
In the end, it is crucially important to understand that markets run in full cycles (up and down). While the bullish “up” cycle last twice as long as the bearish “down” cycle, the damage to investors is not a result of lagging markets as they rise, but in capturing the inevitable reversion. This is something I discussed in “Bulls And Bears Are Both Broken Clocks:”
“In the end, it does not matter IF you are ‘bullish’ or ‘bearish.’ The reality is that both ‘bulls’ and ‘bears’ are owned by the ‘broken clock’ syndrome during the full-market cycle. However, what is grossly important in achieving long-term investment success is not necessarily being ‘right’ during the first half of the cycle, but by not being ‘wrong’ during the second half.”
The markets are indeed in a liquidity-driven up cycle currently. With margin debt near peaks, stock prices in a near vertical rise and “junk bond yields” near record lows, the bullish media continues to suggest there is no reason for concern.
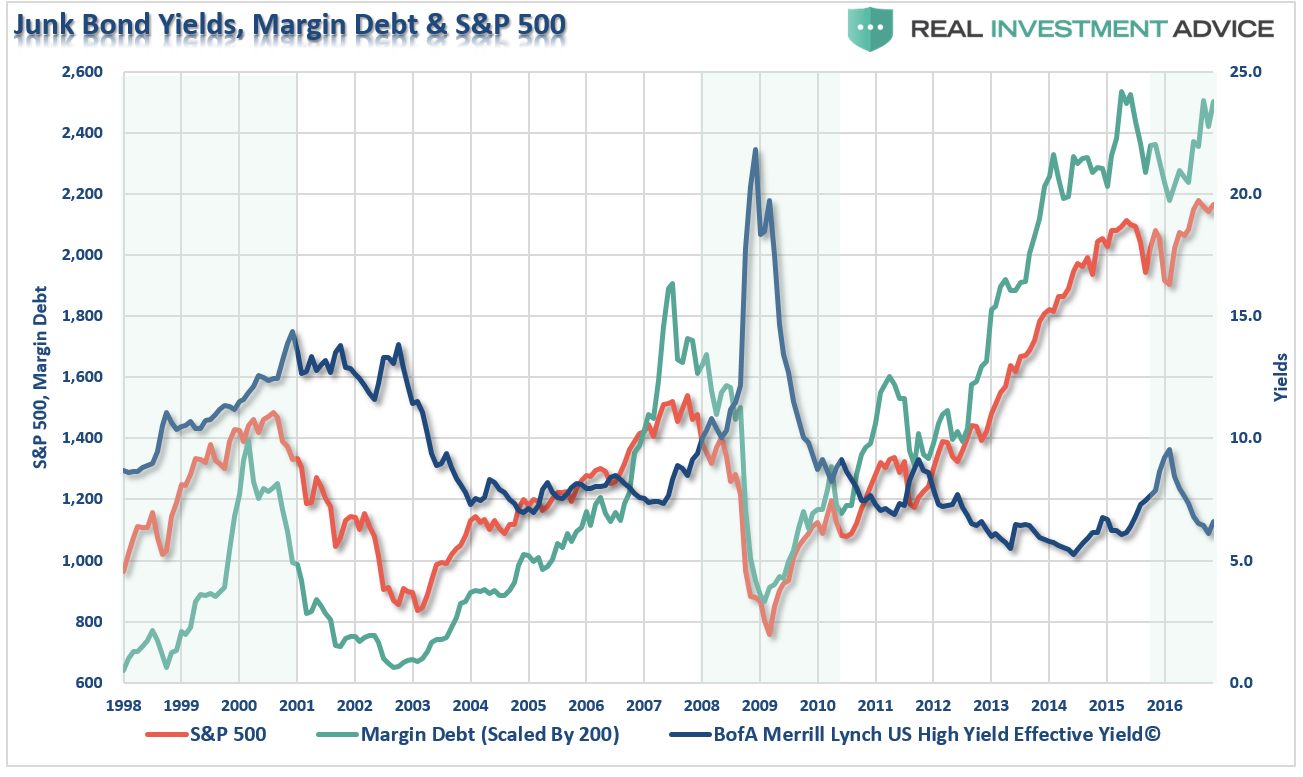
The support of liquidity is being extracted by the Federal Reserve as they simultaneously tighten monetary policy by raising interest rates. Those combined actions, combined with excessive exuberance and risk taking, have NEVER been good for investors over the long term.
At market peaks – everyone’s a “Genius.”
Just some things I am thinking about.
