
As many of you know, I was in San Francisco the week before last where I had been invited to speak at the MoneyShow, one of the biggest, most preeminent investor conferences in the world. Over the past couple of decades, I’ve spoken at many MoneyShows all around the country and have covered many different topics.
Gold investing is one that often draws a big crowd. Not this year. Guess which natural resource stole the show?
The commodity that attracted attendees’ attention is one that until pretty recently could only be grown and harvested under the shroud of secrecy. Marijuana. Currently legal in 23 states and the District of Columbia, medical marijuana generated $2.7 billion in 2014 and is expected to bring in $3.4 billion this year. Investors are taking notice. The cash crop is even starting to change intranational migration. Whereas many retired seniors flock to warmer climates in which to live out their golden years, others now factor in whether a state will permit them to self-medicate in order to treat their arthritis, according to a recent Time article.
Investors themselves who might have suffered from arthritis attended the pot presentation at their own risk, as it was standing room only. They couldn’t have been pulled away even to sit comfortably in the scarcely occupied room next door. Sentiment toward gold was indeed very bearish at the MoneyShow, as it is around the world right now.
Gold Hits the Reset Button
Gold is universally recognized as a safe-haven investment, a go-to asset class when others look uncertain. Following the 2008 financial crisis, for instance, the metal’s price surged, eventually topping out at $1,900 per ounce in August 2011.
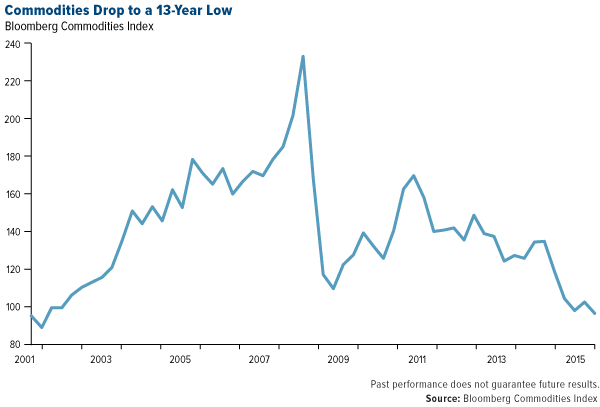
But last week proved to be a particularly rocky one for the metal, even with Greece and Puerto Rico’s debt dilemmas, not to mention the recent Shanghai stock market decline, fresh in investors’ minds. Gold traded down for 10 straight sessions to end the week at $1,099 per ounce, its lowest point in more than five years. Commodities in general dropped to a 13-year low.
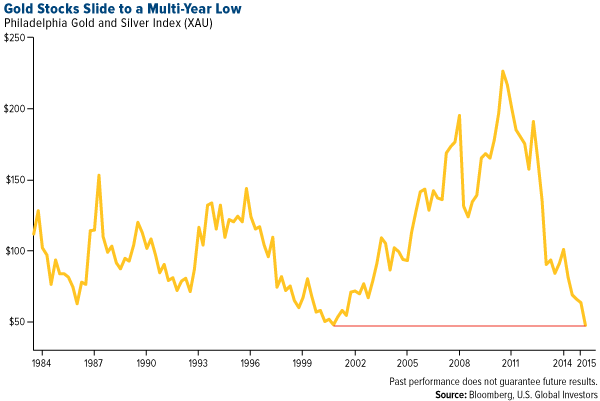
Gold stocks, as expressed by the XAU, also tumbled.
The selloff was given a huge push when China, for the first time in six years, revealed the amount of gold its central bank holds. Although the number jumped nearly 60 percent since 2009 to 1,658 tonnes, markets were underwhelmed, as they had expected to see double the amount.
Then in the early hours last Monday, gold experienced a “mini flash-crash” after five tonnes appeared on the Asian market. Initially this might not sound like a lot, but five tonnes equates to 176,370 ounces, or about $2.7 billion. It also represents about a fifth of a normal day’s trading volume. Suffice it to say, price discovery was effectively disrupted. In a matter of seconds, gold fell 4 percent before bouncing back somewhat.
Reflecting on the trading session, widely-respected market analyst Keith Fitz-Gerald noted: “Far from being a one-day crash, this could represent one of the best gold-buying opportunities of the year.”
The last time the metal descended this quickly was 18 months ago, on January 6, 2014, when someone brought a massive gold sell order on the market before retracting it in a high-frequency trading tactic called “quote stuffing.” Last month I shared with you that we now know who might have been responsible for the action—and many others that preceded it—and pointed out that the accused party’s penalty of $200,000 was grossly inadequate. Last Monday I told Daniela Cambone during the Gold Game Film that such downward price manipulation seems to result in little more than a slap on the wrist. But if manipulation is done on the upside, traders could get into serious trouble.
Besides apparent price manipulation, other factors are affecting gold’s behavior right now, three in particular.
1. Strong U.S. Dollar
Like crude oil, gold around the world is priced in US dollars. This means that when the greenback gains in strength, the yellow metal becomes more expensive for overseas buyers. With the US economy on the mend after the recession, the dollar index remains steady at a 12-year high.
It’s important to recognize, though, that gold is still strong in other world currencies, including the Canadian dollar. As such, our precious metals funds have hedged Canadian dollar exposure for Canadian gold stocks, which has benefited our overall performance.
2. Interest Rates on the Rise?
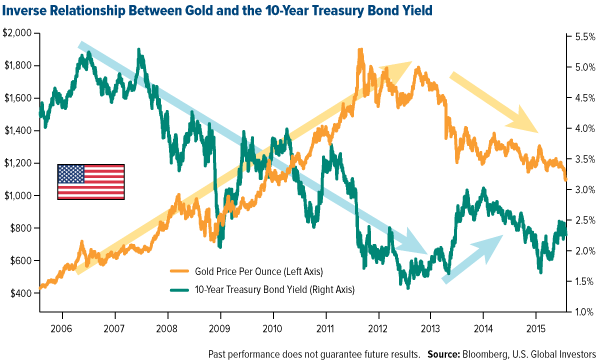
Federal Reserve Chair Janet Yellen continues to hint that interest rates might be hiked sometime this year, perhaps even as early as September. When rates move higher, non-yielding assets such as gold often take a hit.
As you can see, the 10-Year Treasury Bond yield and gold have an inverse relationship. When the yield starts to rise, investors might find bonds a more attractive asset class.
3. Slowing Manufacturing Activity
Earlier this month I wrote about the downtrend in manufacturing activity across the globe. As many loyal readers are well aware, we closely monitor the global purchasing manager’s index (PMI) because, as our research has shown, when the one-month reading has fallen below the three-month moving average, select commodity prices have receded six months later.
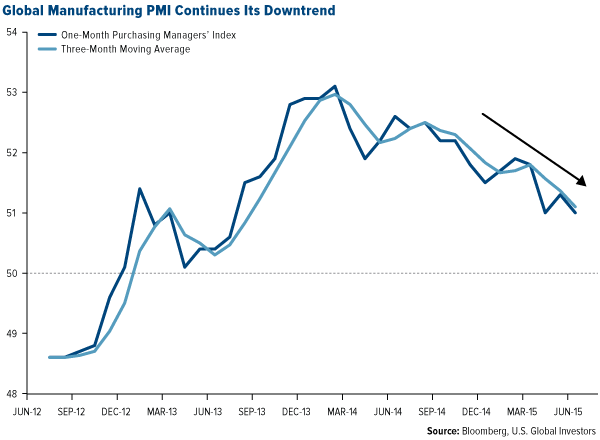
China is the 800-pound commodity gorilla, and its own PMI has remained below the important 50 threshold for the last three months, indicating contraction. The preliminary flash PMI, released last Friday, shows that manufacturing has dipped to 48.2, a 15-month low. For gold and other commodities to recover, it’s crucial that China jumpstart its economy.
In the meantime, we’re encouraged by news that the slump in prices has accelerated retail demand in both China and India, which, when combined, account for half of the world’s gold consumption.
Battening Down the Hatches
They say that a smooth sea never made a skillful sailor. No one embodies this more than Ralph Aldis, portfolio manager of our precious metals funds. He and our talented team of analysts are doing a commendable job weathering this storm. We’re invested in strong, reliable companies, and when commodities eventually turn around, we should be in a good position to catch the wind.
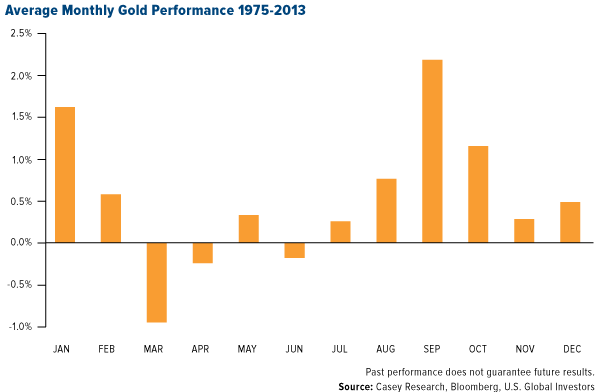
We look forward to the second half of the year, when gold prices have historically seen a bump in anticipation of Diwali, which falls on November 11 this year, and the Chinese New Year. As you can see, average monthly gold performance has ramped up starting in September.
“Gold is down 15 to 25 percent below production levels,” Ralph says. “That might cause some companies to halt production.”
And, in so doing, help prices find firmer footing.
After my trip to San Francisco, an important rallying point for the 1960s counterculture movement, it only seems fitting that I traveled to Colorado, one of the first states to legalize cannabis for recreational use. It was only a coincidence that Julia Guth chose to retreat to the state’s beautiful mountains for the Oxford Club’s educational seminar. It was a privilege to present to two assemblies of curious investors like yourself. I enjoy meeting many of you when I’m on the road.
The Bloomberg Commodity Index (BCOM) is a broadly diversified commodity price index distributed by Bloomberg Indexes. The index was originally launched in 1998 as the Dow Jones-AIG Commodity Index (DJ-AIGCI) and renamed to Dow Jones-UBS Commodity Index (DJ-UBSCI) in 2009, when UBS acquired the index from AIG. The Philadelphia Gold and Silver Index (XAU) is a capitalization-weighted index that includes the leading companies involved in the mining of gold and silver.
The J.P. Morgan Global Purchasing Manager’s Index is an indicator of the economic health of the global manufacturing sector. The PMI index is based on five major indicators: new orders, inventory levels, production, supplier deliveries and the employment environment.
All opinions expressed and data provided are subject to change without notice. Some of these opinions may not be appropriate to every investor.
