What’s better than a portfolio that will pay you a $117,000 salary every year in retirement?
How about one that delivers a consistent paycheck each and every month that you can plan all of your regular expenses around?
I’ll show you how, via with three already-diversified high-yield monthly dividend stocks. But first, let me show you how most income investors get it wrong.
Mistake 1: Cheating Themselves on Yield
Sure, yield isn’t everything—you want growth potential, dividend growth potential and safety, too—but it matters. Consider this: Every 1% in yield equates to $10,000 on a $1 million nest egg. Thus, 2% is $20,000, 3% is $30,000, and so forth.
So what do you think you would bring in if you invested in well-known dividend stocks like, say, the Dividend Aristocrats?
A mere $1,675 per month—not all that much more than what you’d get by investing in the S&P 500.
No disrespect meant to the Dividend Aristocrats. The ability to grow your dividends for more than a quarter century without skipping a beat is a great accomplishment. It demonstrates outstanding management across bull and bear markets, up and down economies alike.
But the average dividend paid across the Aristocrats today is just too darn low. And in many cases, the rate of dividend growth has slowed to a crawl—exactly what you’d expect after decades of distribution hikes stretch payout ratios a little thin.
And remember: If you don’t make enough income from your investments, you’ll be forced to sell your stocks to pay the bills. This means you could suffer catastrophic losses if you’re forced to sell in the middle of a bear market!
Mistake 2: Building a “Lumpy” Portfolio
Most blue-chip dividend stocks pay out investors every three months. If you’re aware of that, and vigilant about how you construct your portfolio, you could build a dividend calendar that pays you roughly the same amount every month. But that begins to get tricky as you add to quality positions and pull back on struggling stocks.
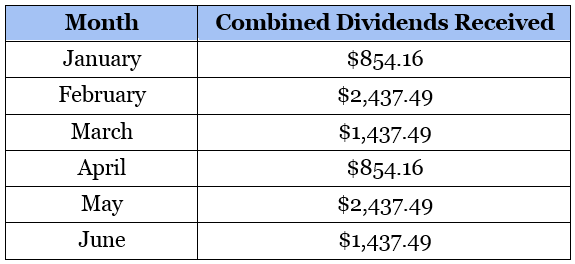
And most investors? They simply put together a pile of big, popular stocks and take the cash as it comes. Consider this real payout schedule I’ve compiled using six popular dividend-paying blue chips such as AT&T (NYSE:T), AbbVie (NYSE:ABBV) (ABV), Target (NYSE:TGT), Sysco (NYSE:SYY) and Chevron (NYSE:CVX):

Not only is this a “not-enough” amount of monthly income, but it also varies widely—by more than $1,500 in some months!
Those are two problems with one simple fix: high-yield monthly dividend stocks.
Monthly dividend payers are exactly what they sound like: They’re a surprisingly small subset of stocks, REITs (real estate investment trusts), closed-end funds (CEFs) and other assets that pay out their dividends on a monthly basis rather than quarterly. And more often than not, they dole out yields that crush the S&P 500 several times over.
Let me introduce you to a small batch of these monthly payers that will deliver an eye-popping average yield of 11.7%.
Tekla World Healthcare Fund (THW)
Dividend Yield: 10.9%
If the Tekla World Healthcare Fund (Tekla World Healthcare Fund (NYSE:THW)) were just any old ordinary healthcare fund, it would provide broad exposure to a wide set of healthcare plays—pharmaceuticals, biotechs—and throw off a meager yield. The ubiquitous Health Care Select Sector SPDR Fund (XLV), for instance, pays just 1.6% as I write this.
But THW is no ordinary healthcare fund.
Tekla is the provider of several healthcare closed-end funds (CEFs) —a relatively rare breed compared to CEFs’ typical focus: high-yield assets such as REITs, preferreds and junk debt.
Tekla World Healthcare Fund does, like XLV, provide exposure to a wide array of healthcare assets, such as pharma, biotech, health care providers, medical device companies and even medical REITs. It also takes things a step further by broadening its horizons to companies outside of the U.S. —so holdings include not just American giants such as Johnson & Johnson (NYSE:JNJ) and Pfizer (NYSE:PFE), but Switzerland’s Novartis (NYSE:NVS) and British-Swedish multinational AstraZeneca (NYSE:AZN).
THW further differentiates itself because of things that it can do as a CEF that many ETFs just can’t, or won’t, do. For instance, Tekla’s fund is only about 80% invested in common stock. It also holds non-convertible notes, convertible preferreds and other investments. And it also uses about 22% leverage to “double down” on certain investments that it thinks have high return potential.
All that allows it to generate an impressive distribution rate of nearly 11%. Better still, an 8% discount to net asset value (NAV) means you’re purchasing these high-quality healthcare assets at 92 cents on the dollar.
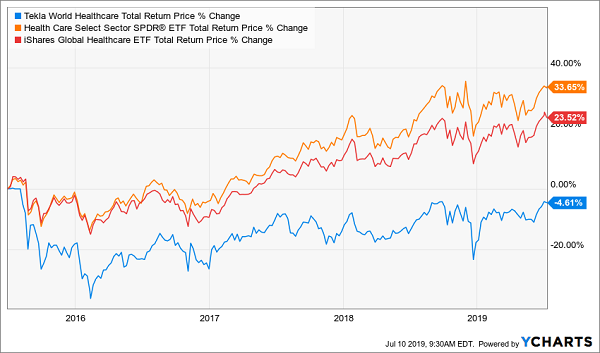
That said, performance has been rocky since inception in 2015, struggling to meet the same strong performance against its peers that its sister funds, Tekla Healthcare Investors (HQH) and Tekla Life Science Investors (HQL), have enjoyed.
Tekla World Healthcare Fund (THW) Could Use a Check-Up 
PIMCO Dynamic Income (NYSE:PDI)
Dividend Yield: 8.3%
PIMCO Dynamic Income (PDI) is another nice monthly dividend payer. It’s also much more traditional in that it invests in one of the primary CEF fields: debt.
PDI has a wide mandate. It’s allowed to invest in mortgage-backed securities, corporate debt (investment-grade and junk, domestic and international), sovereign developed- and emerging-market debt, and other bonds. Typically about 25% of the fund will be invested in mortgage-related debt, and it’ll also invest up to 40% in issuers with emerging-market ties. It’s also shorter-term in nature, typically trying to maintain portfolio duration of zero to eight years.
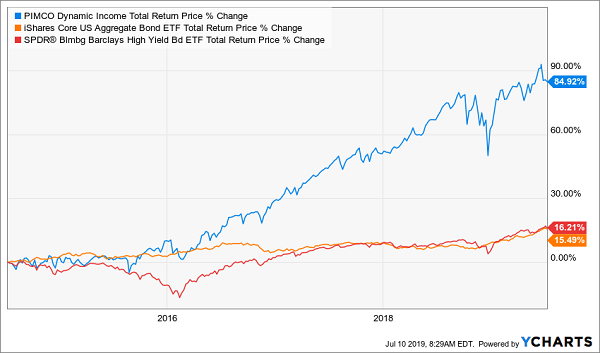
This is a killer fund, stomping both the iShares Core U.S. Aggregate Bond ETF (NYSE:AGG) and SPDR Bloomberg Barclays (LON:BARC) High Yield Bond ETF (NYSE:JNK) over the past five years.
PIMCO’s Dynamic Income Fund Is Dynamite
My only complaint is that it’s quite expensive, trading at a nearly 13% premium to the assets it holds. That makes it difficult to recommend right this very moment for longer-term buy-and-holders.
Oxford Lane Capital (NASDAQ:OXLC)
Dividend Yield: 15.9%
Oxford Lane Capital (OXLC) is one of those funds that force you to weigh a lot of significant factors against one another.
Pros:
- It pays a monthly distribution.
- It pays a really, really big monthly distribution.
- Active management is helping you invest in one of the most complex investments I can think of: collateralized loan obligations (CLOs)—basically a bunch of higher-risk business loans bundled together to try to defray some of that risk.
Cons:
- CLOs are far from consistent, so from time to time, funds like OXLC are forced to cut their distributions to reflect what’s being paid out from these assets.
- The expenses. Morningstar lists OXLC’s expense ratio as 12.8%! Yes, closed-end funds typically have much higher fees than exchange-traded funds because they’re typically actively managed while ETFs often are not, and because CEFs often use leverage and trade options, which requires skilled hands. Indeed, a large portion of that expense ratio is interest expense. And again, Oxford Lane is managing an extremely complex set of assets that few others deal in, so you’re bound to pay a premium. But at the end of the day, this is an enormously expensive fund that necessitates sky-high returns to justify its existence.
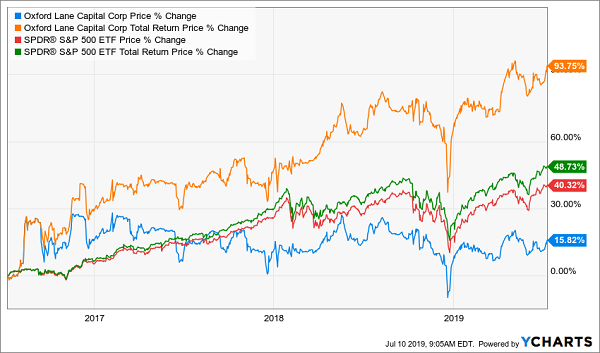
Oxford Lane Capital (OXLC): Worth It as Long As It Outperforms
Disclosure: Brett Owens and Michael Foster are contrarian income investors who look for undervalued stocks/funds across the U.S. markets. Click here to learn how to profit from their strategies in the latest report, "7 Great Dividend Growth Stocks for a Secure Retirement."
