3 Charts Illustrate Commodities Now A Better Bet Than Equities

Published 12/27/2020, 12:04 AM
Updated 07/09/2023, 06:31 AM
NDX
-
HG
-
KC
-
CL
-
NG
-
LCc1
-
ZS
-
ZC
-
USO
-
MAL
-
LXRc1
-

The late 1990s represented a period in history when investors began paying ridiculous premiums to own growth stocks. After the stock bubble burst in 2000, growth stocks in the NASDAQ 100 collectively crashed 80%.

In 2020? The investment community is at it again.
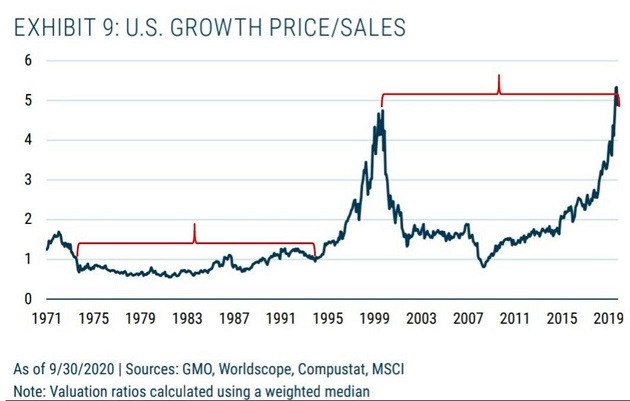
US Growth Price/Sales Chart

This time, however, participants have the Federal Reserve and federal government’s explicit backing. Government has created 60 additional cents for every dollar that existed at the start of the year.

They call it liquidity. We call it “money printing.”
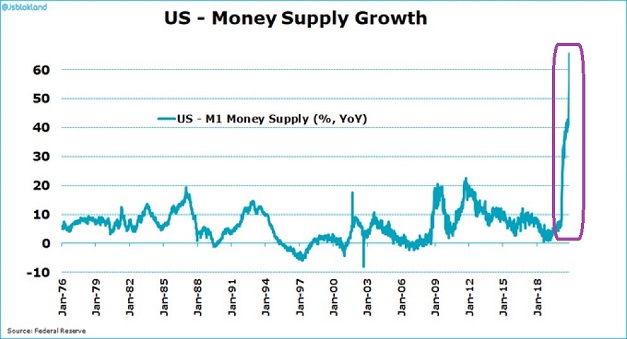
US Money Supply Growth

Money printing can continue to support stock prices for as long as investors are inclined to speculate. Indeed, at present, a seemingly endless supply of dollars is overwhelming a limited number of shares.

On the other hand, unchecked dollar creation may lead to dramatically higher living costs (a.k.a. “inflation”). And if that occurs, one might do better with commodities than he/she will do with hyper-valued stocks.

Oil, gas, copper, aluminum, corn, soybeans, cattle, coffee, lumber. A basket of commodities is cheap when compared to a basket of stocks.
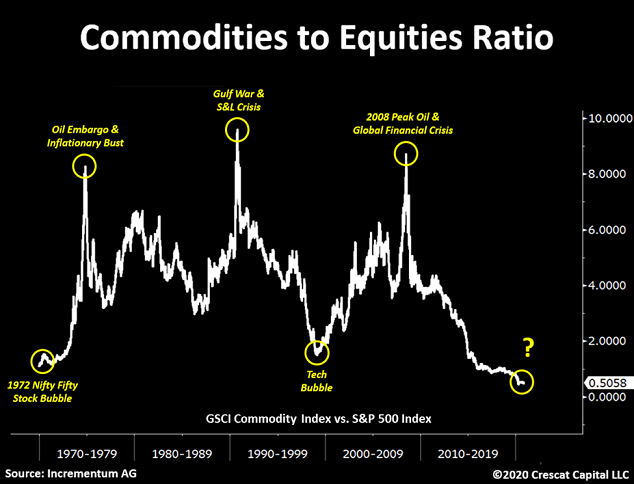
Commodities To Equity Ratio Chart

Latest comments

Loading next article…
Risk Disclosure: Trading in financial instruments and/or cryptocurrencies involves high risks including the risk of losing some, or all, of your investment amount, and may not be suitable for all investors. Prices of cryptocurrencies are extremely volatile and may be affected by external factors such as financial, regulatory or political events. Trading on margin increases the financial risks.
Before deciding to trade in financial instrument or cryptocurrencies you should be fully informed of the risks and costs associated with trading the financial markets, carefully consider your investment objectives, level of experience, and risk appetite, and seek professional advice where needed.
Fusion Media would like to remind you that the data contained in this website is not necessarily real-time nor accurate. The data and prices on the website are not necessarily provided by any market or exchange, but may be provided by market makers, and so prices may not be accurate and may differ from the actual price at any given market, meaning prices are indicative and not appropriate for trading purposes. Fusion Media and any provider of the data contained in this website will not accept liability for any loss or damage as a result of your trading, or your reliance on the information contained within this website.
It is prohibited to use, store, reproduce, display, modify, transmit or distribute the data contained in this website without the explicit prior written permission of Fusion Media and/or the data provider. All intellectual property rights are reserved by the providers and/or the exchange providing the data contained in this website.
Fusion Media may be compensated by the advertisers that appear on the website, based on your interaction with the advertisements or advertisers.
© 2007-2025 - Fusion Media Limited. All Rights Reserved.