2nd Quarter Indecision Signalled On SPX:VIX Ratio

Published 05/21/2017, 12:29 AM
Updated 07/09/2023, 06:31 AM
US500
-
VIX
-

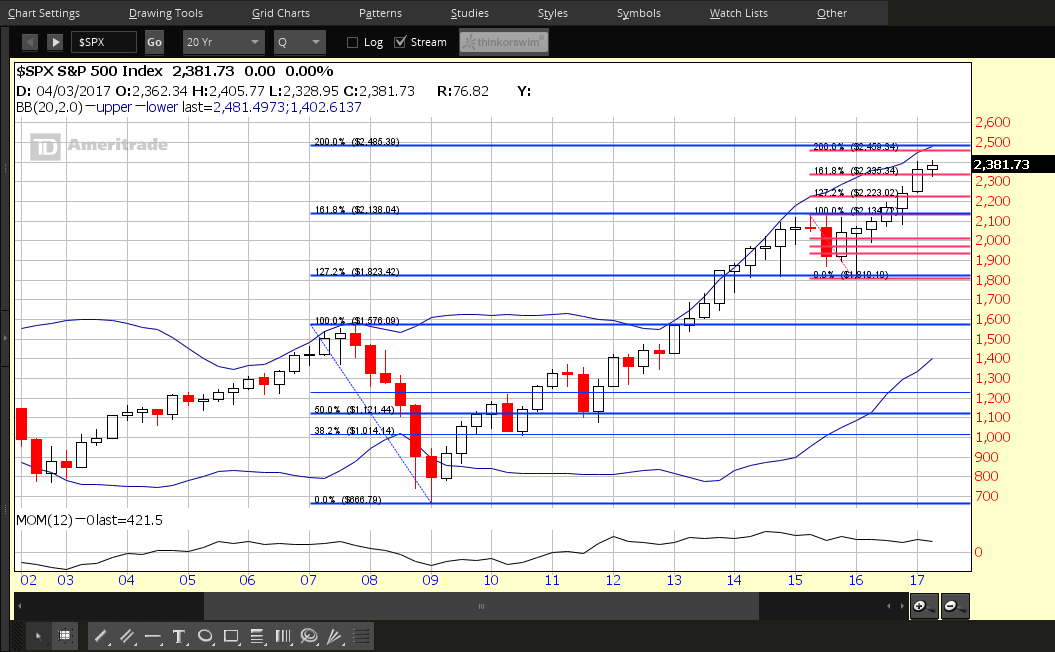
Each candle on the following chart of the SPX represents a period of one quarter. Much of the action on the current Q2 candle has occurred above the top one-quarter of Q1, and price is hovering above its close of 2362.72.

The Momentum indicator has been sluggish since July 2014 on this timeframe, likely caused by the rise in volatility, large price swings and inability of this index to gain traction, until its breakout two years later.

SPX Quarterly 2002-2017

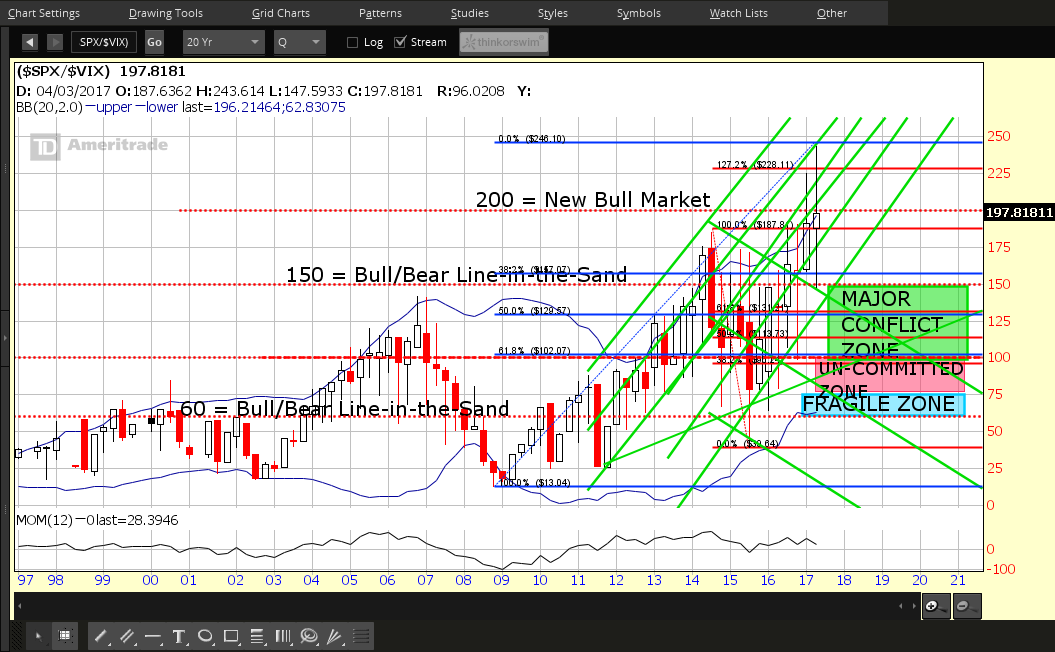
Each candle on the following SPX:VIX ratio chart represents a period of one quarter. The current Q2 candle is a high-wave candle and its range is 96 points. This is signalling extreme indecision in support (or not) going forward for equities in the face of rising high volatility.

Price on on the Q2 candle is hovering above the Q1 close of 191.004, but is below 200.00...a level which, I've contended (and written about) for some time, represents a new bull market in equities.

However, in order for price to break and stay above 200.00, volatility will need to calm down and remain low. We may need to wait and see how the Q2 candle closes at the end of June to try and gauge what market sentiment may hold for the remainder of the year. At the moment, it's anyone's guess, although you may see a last-ditch spike in price on the SPX before the Fed's next interest rate announcement and Fed Chair press conference on June 14.

SPX/VIX Quarterly 1997-2017

Latest comments

Loading next article…
Risk Disclosure: Trading in financial instruments and/or cryptocurrencies involves high risks including the risk of losing some, or all, of your investment amount, and may not be suitable for all investors. Prices of cryptocurrencies are extremely volatile and may be affected by external factors such as financial, regulatory or political events. Trading on margin increases the financial risks.
Before deciding to trade in financial instrument or cryptocurrencies you should be fully informed of the risks and costs associated with trading the financial markets, carefully consider your investment objectives, level of experience, and risk appetite, and seek professional advice where needed.
Fusion Media would like to remind you that the data contained in this website is not necessarily real-time nor accurate. The data and prices on the website are not necessarily provided by any market or exchange, but may be provided by market makers, and so prices may not be accurate and may differ from the actual price at any given market, meaning prices are indicative and not appropriate for trading purposes. Fusion Media and any provider of the data contained in this website will not accept liability for any loss or damage as a result of your trading, or your reliance on the information contained within this website.
It is prohibited to use, store, reproduce, display, modify, transmit or distribute the data contained in this website without the explicit prior written permission of Fusion Media and/or the data provider. All intellectual property rights are reserved by the providers and/or the exchange providing the data contained in this website.
Fusion Media may be compensated by the advertisers that appear on the website, based on your interaction with the advertisements or advertisers.
© 2007-2025 - Fusion Media Limited. All Rights Reserved.