50% Off! Beat the market in 2025 with InvestingProCLAIM SALE

2400 In Store For The S&P 500?

Published 10/30/2018, 01:44 AM
Updated 07/09/2023, 06:31 AM
US500
-
XHB
-
XLF
-
VIX
-

Further to my post of October 21, the U.S. Homebuilders ETF (NYSE:XHB) decline continues. Price is now sitting just beneath its long-term 38.2% Fibonacci retracement level of 32.33, which had represented a first major support level (now major resistance). Second major support level (50% Fib retracement) sits at 27.60.

The following weekly comparison chart shows price action of the SPX (green bars), XLF (pink) and XHB (blue) pre and post-2008/09 financial crisis.

You'll note that the XHB entered into a steep decline well ahead of the SPX and XLF in mid-2006...which was a strong indicator of major weakness in that sector and a precursor and barometer of systemic weakness in U.S. equities, in general.

Conversely, it began to accelerate at a faster pace in mid-2012 before it moved lock-step with the other two until they all peaked in January of this year.

All three, subsequently, pulled back, but while the SPX then rallied to new highs, the XLF and, in particular, the XHB did not. In fact the XHB has declined at an alarming rate since early September.
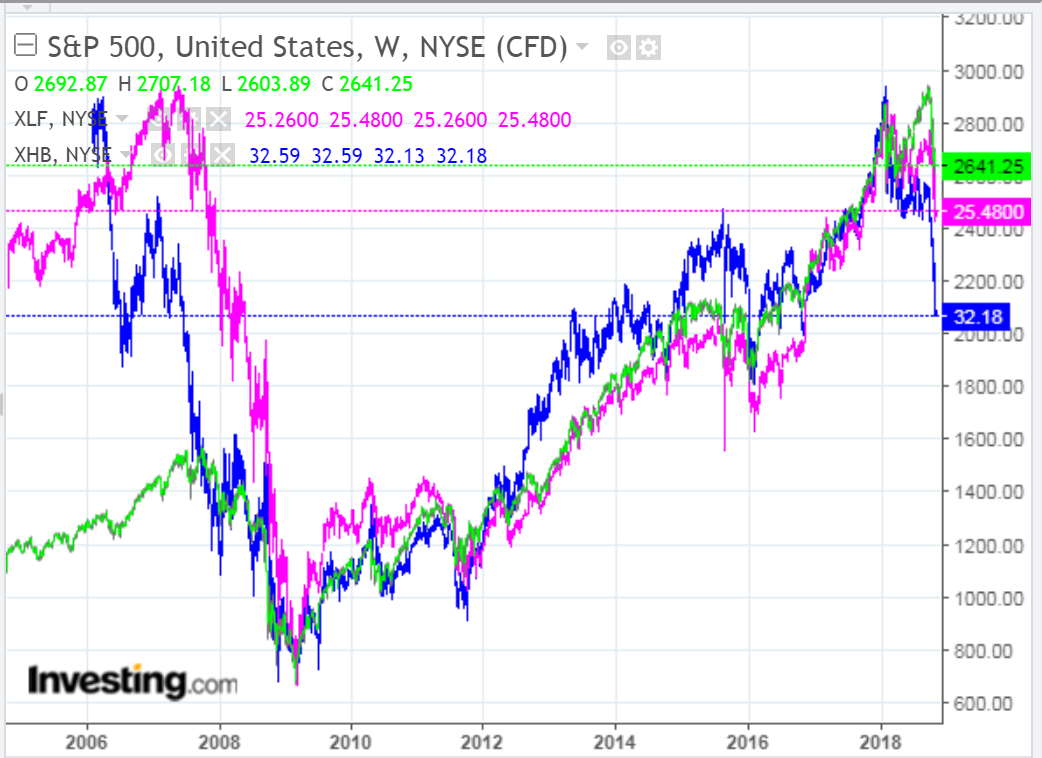
S&P 500:XLF:XHB Weekly

The following year-to-date percentages gained/lost graph illustrates the comparative weakness of the XHB for 2018.

A failure of the XHB to take a leadership role in regaining strength would, no doubt, drag the SPX and XLF down further...assuming that historical movements in markets haven't dramatically changed recently.

In that regard, watch for a break and hold below 2600 on the SPX (a level I had identified as near-term major support in my post of October 11) as a signal that further SPX weakness lies ahead...possibly to its next major support level as low as 2400, which correlates to a long-term uptrending Fibonacci fan line, as shown in my post of August 6.

SPX:XLF:XHB YTD Performance

Keep an eye on the 100 level on the following daily SPX:VIX ratio chart, inasmuch as a break and hold below could see the SPX reach that 2400 level...especially if it breaks and holds below 60 and we see another bearish moving average Death Cross form.
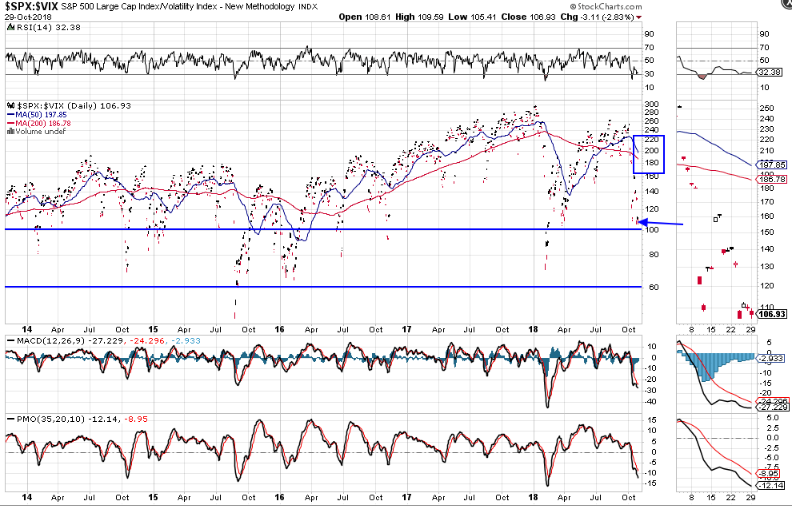
SPX-VIX Daily Chart

Latest comments

Loading next article…
Risk Disclosure: Trading in financial instruments and/or cryptocurrencies involves high risks including the risk of losing some, or all, of your investment amount, and may not be suitable for all investors. Prices of cryptocurrencies are extremely volatile and may be affected by external factors such as financial, regulatory or political events. Trading on margin increases the financial risks.
Before deciding to trade in financial instrument or cryptocurrencies you should be fully informed of the risks and costs associated with trading the financial markets, carefully consider your investment objectives, level of experience, and risk appetite, and seek professional advice where needed.
Fusion Media would like to remind you that the data contained in this website is not necessarily real-time nor accurate. The data and prices on the website are not necessarily provided by any market or exchange, but may be provided by market makers, and so prices may not be accurate and may differ from the actual price at any given market, meaning prices are indicative and not appropriate for trading purposes. Fusion Media and any provider of the data contained in this website will not accept liability for any loss or damage as a result of your trading, or your reliance on the information contained within this website.
It is prohibited to use, store, reproduce, display, modify, transmit or distribute the data contained in this website without the explicit prior written permission of Fusion Media and/or the data provider. All intellectual property rights are reserved by the providers and/or the exchange providing the data contained in this website.
Fusion Media may be compensated by the advertisers that appear on the website, based on your interaction with the advertisements or advertisers.
© 2007-2024 - Fusion Media Limited. All Rights Reserved.