There is a price war going on among fund sponsors with some ETFs now having expense ratios from 3 basis points to 5 basis points.
Keeping costs low is key to long-term returns generally, and specifically to index funds.
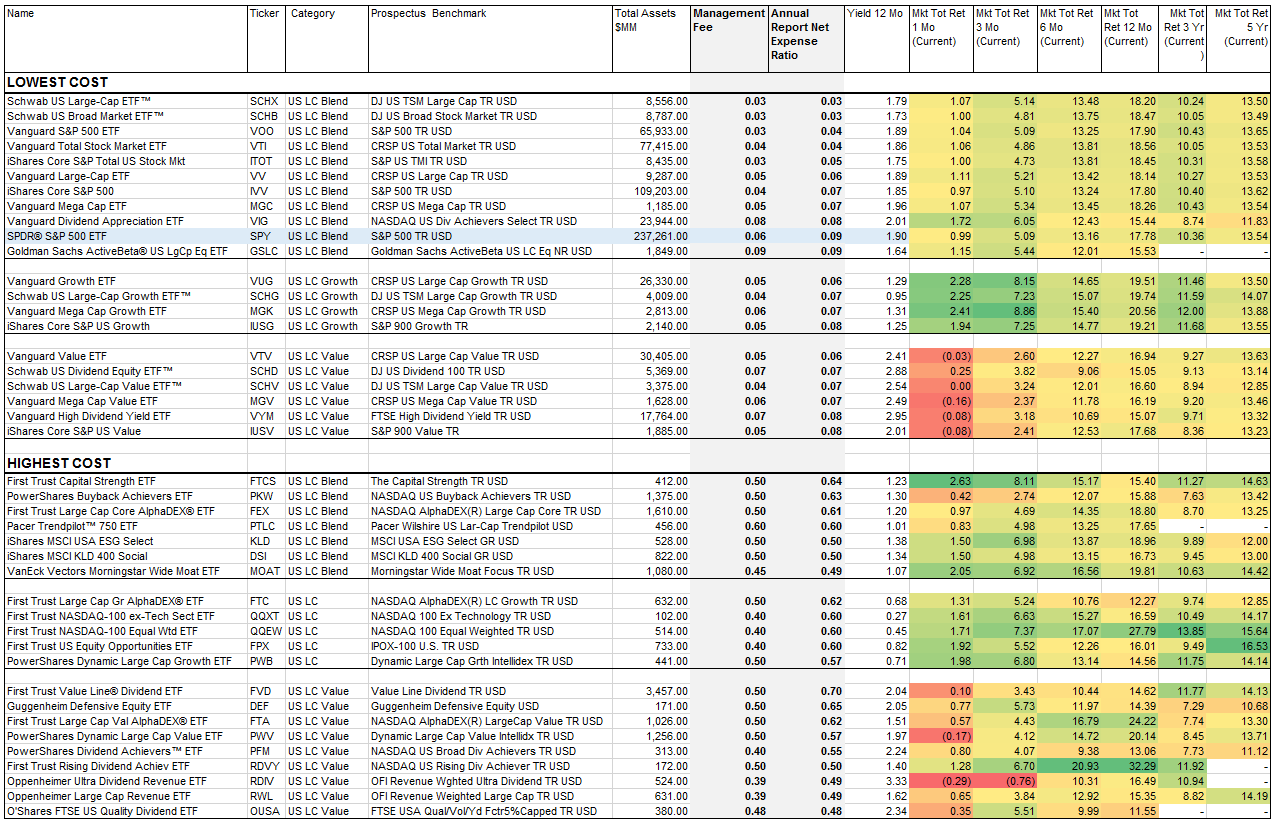
Here is a list of the 21 lowest expense ratio and 21 highest expense ratio US large-cap ETFs that have at least $100 million of assets under management.

The largest ETF (the S&P 500 tracker, SPY (NYSE:SPY)) is among the least expensive at 9 basis points, but more expensive than two other S&P 500 ETFs (ishares S&P 500 (NYSE:IVV) at 7 basis points, and Vanguard S&P 500 (NYSE:VOO) at 4 basis points).
For a $1 million position, 1 basis point amounts to $100 per year; or $200 extra return per year with IVV and $500 per year extra return with VOO.
If all you want to do is buy and hold the S&P 500, VOO probably is the most sensible approach. On the other hand, if you want to be able to sell covered options on your S&P 500 position for income, you need to stick with SPY.
Schwab has a US large-cap and a US broad market (also large-cap) ETF at 3 basis points.
Before you know it, some very large ETFs may have zero expense ratios — it could happen.
How so? Two things possibly:
- Some sponsors may chose to offer “lead funds” such as a US large-cap fund at zero expense (operating at a loss) to gather assets on the assumption that if they can capture a core assets, they have a good shot at capturing other assets that are operated profitably — certainly that has been the case with money market funds for the past 8 years.
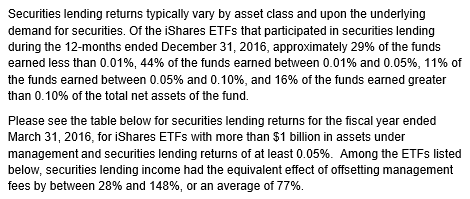
- The combination of mega-size and revenue from securities lending should make is possible to operate at least marginally profitably on some funds to either gather assets, or compete to retain assets against others who lower fees to gather assets. When funds lend securities, they earn a fee, which is shared partially with the manager in most cases (not shared at Vanguard).
iShares, for example keeps from 15% to 28.5% of the securities lending revenue on it funds. If sponsors could live off of the lending revenue share alone, and also make certain competitive asset gathering or retention decisions, expense ratios on some funds could go to zero.
Here is some of what iShares published about securities lending by ETFs:
Whether sponsors do or do not keep a share of securities lending fees, as expense ratios approach zero (and 3 basis point to 5 basis point expense ratios are approaching zero in effect), the impact of securities lending begins to have a significant effect on the tracking error of an index fund — such that on occasion the fund could outperform its benchmark even with the drag of a management fee.
Other important factors that impact tracking error include the amount of cash held for liquidity; the effectiveness of sampling if index replication is not used; and the timeliness and accuracy of rebalancing and reconstitution.
Anyway, we are approaching the time where Warren Buffet’s concern about Wall Street drag on returns, and the damage to investors, may be approaching an end for large index funds. It is typically said that you cannot buy an index, only a fund tracking an index. Well, they two are approaching the point of being one and the same.
Overall, the highest costs US large-cap funds, with expense ratios from 48 to 64 basis points did not do worse than the lowest costs funds.
In fact if you simply average the returns (not asset weighted), the highest cost group did a little bit better than the lowest cost group. That was not due to better management, but to somewhat specialized large-cap strategies that did better, such as technology oriented NASDAQ exposures.
That shows that it is possible for higher fees to be justified in some cases by deviating from the broadest indexes, but that is a case-by-case situation.
If you are buying broad indexes, pay really close attention to expenses as one of the primary drivers. For specialized funds, category relative expenses can be important, but absolute expenses may not be as important as for broad index funds.
Securities Mentioned In This Article:
Schwab US Large-Cap (NYSE:SCHX), Schwab US Broad Market (NYSE:SCHB), VOO, Vanguard Total Stock Market (NYSE:VTI), iShares Core S&P Total US Stock Market (NYSE:ITOT), Vanguard Large-Cap (NYSE:VV), IVV, Vanguard Mega Cap (NYSE:MGC), Vanguard Dividend Appreciation (NYSE:VIG), SPY, Goldman Sachs (NYSE:GS) ActiveBeta US Large Cap Equity (NYSE:GSLC), Vanguard Growth (NYSE:VUG), Schwab US Large-Cap Growth (NYSE:SCHG), Vanguard Mega Cap Growth (NYSE:MGK), iShares Core US Growth (NYSE:IUSG), Vanguard Value (NYSE:VTV), Schwab US Dividend Equity (NYSE:SCHD), Schwab US Large-Cap Value (NYSE:SCHV), Vanguard Mega Cap Value (NYSE:MGV), Vanguard High Dividend Yield (NYSE:VYM), iShares Core US Value (NYSE:IUSV), First Trust Capital Strength (NASDAQ:FTCS), PowerShares International BuyBack Achievers (NASDAQ:IPKW), First Trust Large Cap Core AlphaDEX (NASDAQ:FEX), Pacer Trendpilot 750 (NYSE:PTLC), iShares MSCI USA ESG Select (NYSE:KLD), iShares MSCI KLD 400 Social (NYSE:DSI), VanEck Vectors Morningstar Wide Moat (NYSE:MOAT), First Trust Large Cap Growth AlphaDEX (NASDAQ:FTC), First Trust NASDAQ-100 Ex-Technology Sector (NASDAQ:QQXT), First Trust NASDAQ-100 Equal Weighted (NASDAQ:QQEW), First Trust US IPO (NYSE:FPX), PowerShares Dynamic Large Cap Growth (NYSE:PWB), First Trust Value Line Dividend (NYSE:FVD), Guggenheim Invest Defensive Equity (NYSE:DEF), First Trust Large Cap Value AlphaDEX (NASDAQ:FTA), PowerShares Dynamic Large Cap Value (NYSE:PWV), Performant Financial Corporation (NASDAQ:PFMT), First Trust NASDAQ Rising Dividend Achievers (NASDAQ:RDVY), Oppenheimer Ultra Dividend Revenue (NYSE:RDIV), Oppenheimer Large Cap Revenue (NYSE:RWL), O’Shares FTSE US Quality Dividend (NYSE:OUSA)


