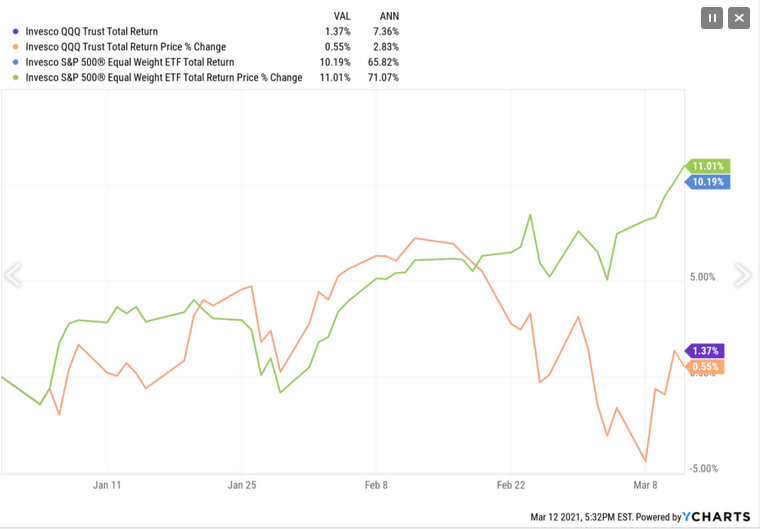
The Invesco S&P 500® Equal Weight ETF (NYSE:RSP) is up about 10% YTD, while the Invesco QQQ Trust (NASDAQ:QQQ) is just barely positive and the S&P 500—before Friday's trading closed, was up about 5% so far in 2021.

From a trading and performance perspective, the action in 2021 is very different than 2020.
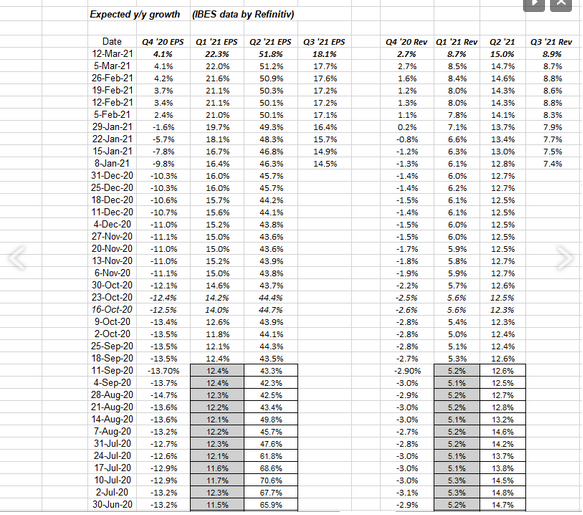
There is little change to the continued upward pressure on S&P 500 EPS and revenue estimates:

Using IBES by Refinitiv data, this spreadsheet shows the continued upward revision to 2021 S&P 500 EPS and revenue estimates.
That’s a good thing.
How does full-year 2021 EPS growth look by sector?

This table was last published on February 5th, 2021.
This site has been updating the spreadsheet weekly with the IBES by Refinitiv data and you’ll note the “expected” full-year 2021 EPS growth rate has changed little in the last 8-12 weeks.
Given the trading in the mega-cap Tech stocks, I thought we’d see the tech sector’s expected EPS growth rate start to decline a little bit, but in fact the Tech sector has improved in the last few weeks.
The 2021 S&P 500 EPS expected growth rates have changed very little this calendar year.
By Market Cap weighting as of March 12 ’21, here is how the S&P 500 sectors rank:
- Technology: +27%
- Health Care: +13%
- Cons Disc: +12%
- Financials: +12%
- Comm Serv +11%
- Industrials: +8%
- Cons Spls: +6%
- Energy: 3%
- Materials: +3%
- Real estate: +2%
- Utilities: +2%
The top 5 sectors are 75% of the S&P 500’s market cap currently. The bottom 4 sectors are just 10% of the S&P 500’s market cap currently. Energy’s monster move in 2021 has only lifted the sector’s market cap weight from 2% to 3%. In 2014, Energy’s weight in the S&P 500 was 14% – 15%.
S&P 500 EPS data (by the numbers):
- The forward 4-qtr estimate jumped to $174.91 this week versus $174.58 last week and $158 as of 12.31.
- The PE ratio this week is 23x
- The S&P 500 earnings yield is 4.44% this week, vs 4.54% last week, and 4.23% on 12/31/20.
- The “average” expected S&P 500 EPS growth rate for 2020 and 2021 combined is now 5.5%
Summary / conclusion: Like George Costanza in Seinfeld, not trusting his instincts and “doing the opposite”, the trade this year is everything that didn’t work last year, up until the 4th quarter, and everything that was working – like mega-cap tech – stopped cold in early Sept ’20.
These trends could remain in place for most of 2021.
More to come over the weekend.
Remember, take all opinions with a grain of salt and understand that capital markets change quickly.
