exceTrend Model signal summary
Trend Model signal: Neutral
Trading model: Bullish
The Trend Model is an asset allocation model which applies trend following principles based on the inputs of global stock and commodity price. In essence, it seeks to answer the question, “Is the trend in the global economy expansion (bullish) or contraction (bearish)?”
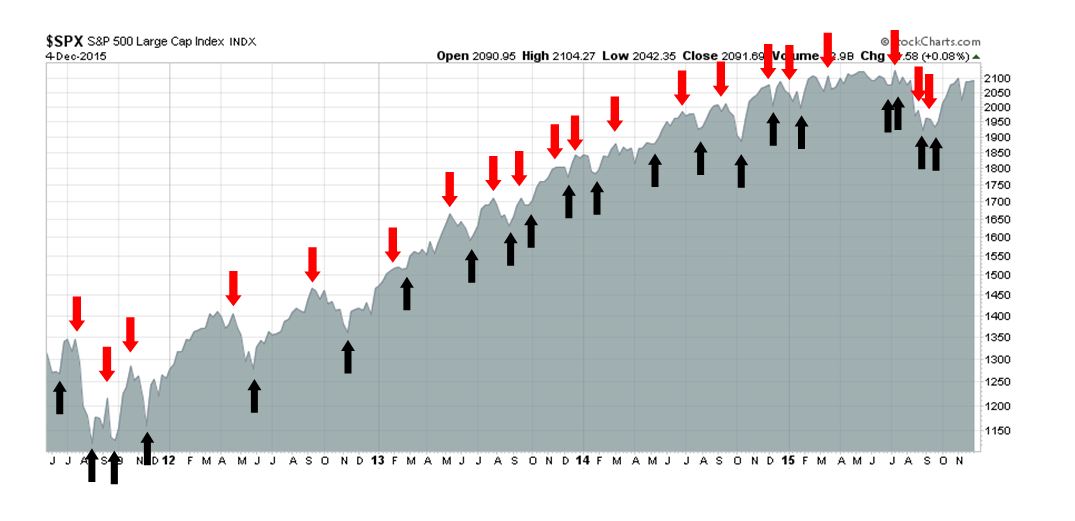
My inner trader uses the trading model component of the Trend Model seeks to answer the question, “Is the trend getting better (bullish) or worse (bearish)?” The history of actual out-of-sample (not backtested) signals of the trading model are shown by the arrows in the S&P 500 chart below.
Update schedule: I generally update Trend Model readings on weekends and tweet any changes during the week at @humblestudent.
My worries for 2016
As the above chart shows, I have been pretty bullish on equities since the market bottomed in September. As I peer into 2016, however, ominous signs are starting to appear. For my inner investor, the key question is whether to go full Zero Hedge* and turn bearish on the outlook for 2016. Here is my list of worries:
- The credit markets are behaving badly, which is a warning of falling risk appetite.
- As the Fed starts its tightening cycle, the fallout could be considerable:
- The banking system is tightening credit and the combination of rising rates and credit rationing would be a double whammy for economic growth.
- Housing, which has been a key driver of employment growth, is starting to stall.
- Excessive equity valuation is showing up in the form of shrinking takeover premiums.
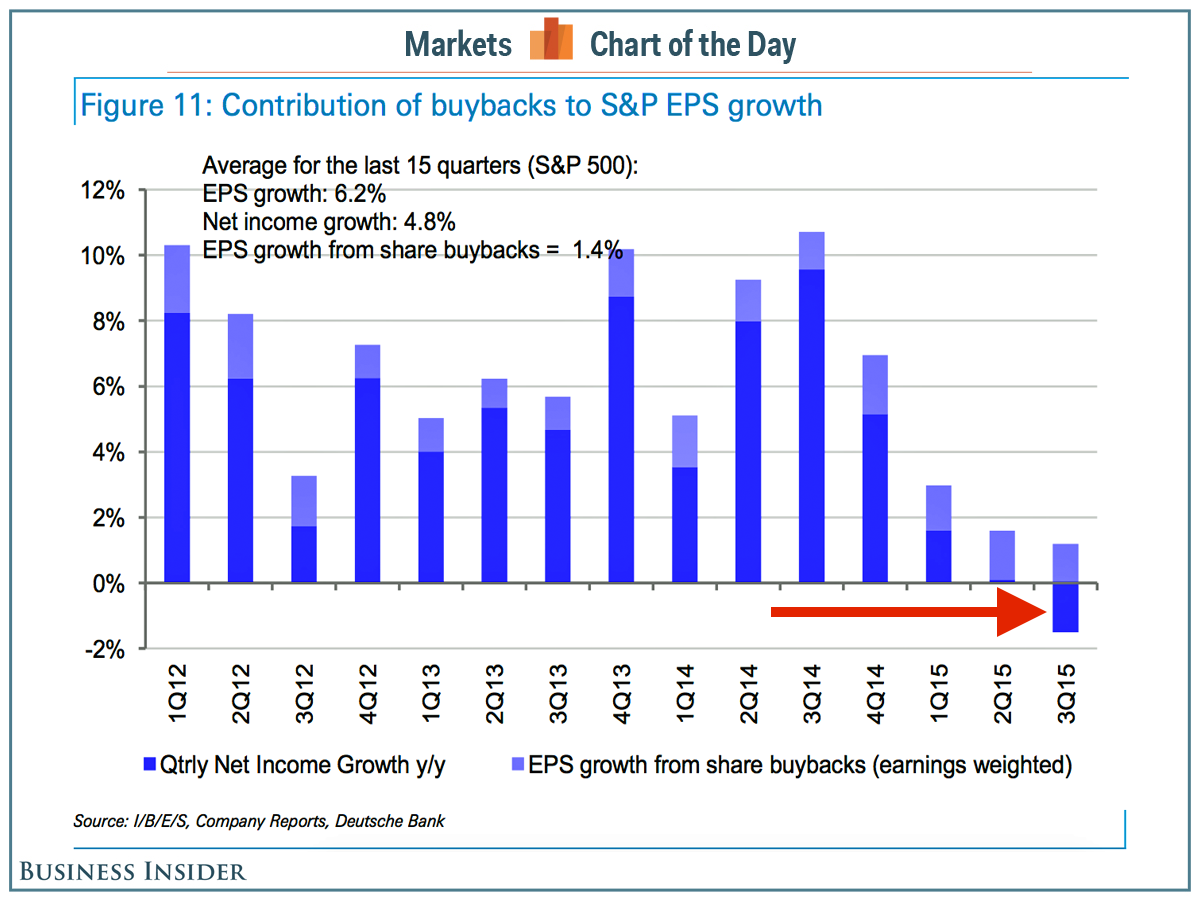
- Stock buybacks, which had long been a driver of stock returns and EPS growth, are losing their power.
Let me go through these points one by one and give my reaction afterwards.
* For the uninitiated, Zero Hedge is a website that is dedicated to the bear case and features end-to-end Apocalyptic forecasts.
Mis-behaving credit
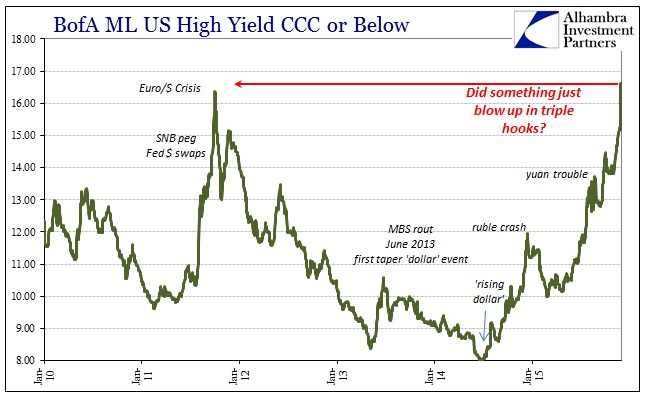
The credit market is one of the key barometers of global risk appetite and it is flashing ominous signals. Zero Hedge recently asked rhetorically if something is blowing up the junk bond market:
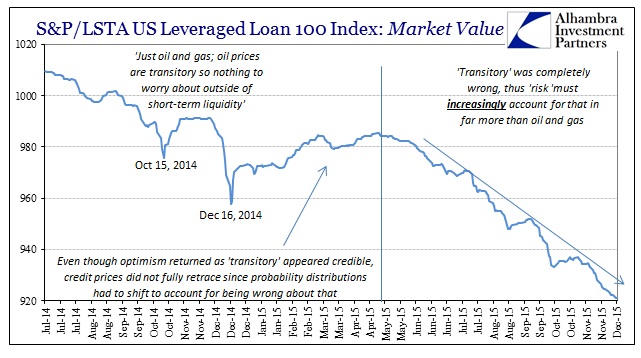
Similar problems are showing up in leveraged loans as well, which is also a vulnerability identified by Jesse Felder.
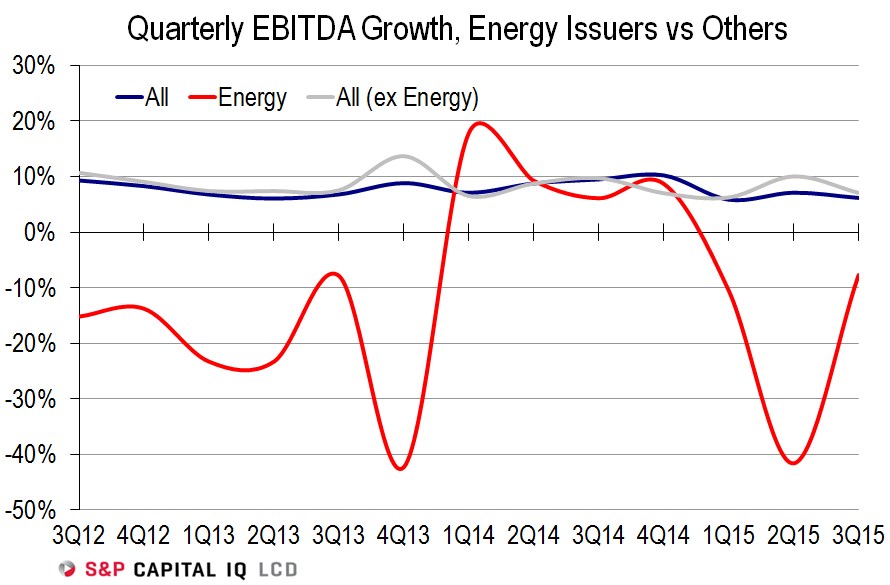
The problems in the credit market are not just confined to the energy sector. LeveragedLoans.com reports that EBITDA growth fell in the quarter ex-energy, even as energy EBIDTA growth rates improved, or got less bad, in the same period.
Bloomberg reports that the upheavals in the junk bond market are warning signs for markets:
Investors are shunning the lowest-rated junk bonds. That is underscored by the extra yield that investors are demanding to hold CCC rated credits relative to those rated BB. This has jumped to the most in six years.
With confidence slipping in the strength of the global economy, there are fewer investors to take the opposite side of a trade in the riskiest parts of the market, according to Oleg Melentyev, the head of U.S. credit strategy at Deutsche Bank).
“These are all small dominoes in one corner of the market,” Melentyev said. “In the early stage, all of this looks random when there is no underlying news to support the big moves. But eventually a narrative emerges — maybe we have turned the corner on the credit cycle.”
Is the Fed tightening into a recession?
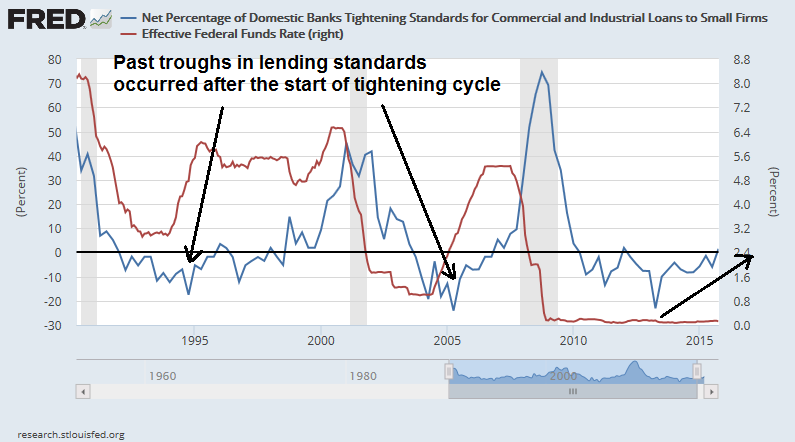
Remember that this is all happening even before the Fed has begun its tightening cycle, which is worrisome. The WSJ recently reported that banks are tightening small business lending standards, which is pushing this class of borrowers into more expensive sources of credit, such as credit cards:
The biggest banks in the U.S. are making far fewer loans to small businesses than they did a decade ago, ceding market share to alternative lenders that charge significantly higher rates.
Together, 10 of the largest banks issuing small loans to business lent $44.7 billion in 2014, down 38% from a peak of $72.5 billion in 2006, according to an analysis of the banks’ federal regulatory filings.
Through August, banks this year originated 43% of business loans of up to $1 million, down from 58% for all of 2009, according to PayNet Inc., a tracker of small business credit.
The change has opened the door to higher-cost alternatives: Nonbank lenders increased their market share to 26% from 10%, with corporations that lend to their business customers or suppliers making up the balance.
“At least 60% of our borrowers would fall into classic bank lending criteria,” said Rob Frohwein, chief executive of online lender Kabbage Inc., which charges rates that average about 39%, versus the typical 5% to 6% or so that banks charge small firms with good credit.
At some big banks, the credit card has become the default loan source for small businesses. Rates on cards issued to small businesses average 12.85%, according to Creditcards.com.
In the past two economic cycles, the trough in bank lending criteria has occurred after the Fed started raising interest rates and the growth outlook was robust enough to deal with tougher standards. This time, tougher lending standards have appeared well before the start of the tightening cycle. In effect, the Fed is raising rates even as the economy is becoming more fragile.
The lumber market warning
The lumber market, which is a key barometer of the housing market, is also flashing red. Tom McClellan recently wrote about the warning signs from lumber:
There are a lot of leading economic indicators in use these days, but the one I like the best is lumber futures prices. Perhaps this is because almost no one else seems to pay attention to them as an economic gauge. Lumber prices tell us pretty reliably and ahead of time about what is going to happen to real estate prices and activity, plus interest rates. They can even tell us about what unemployment is going to do.
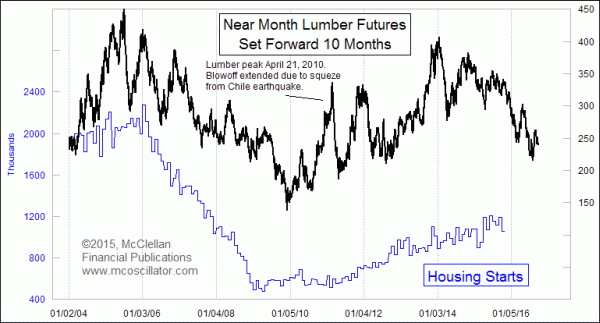
He concluded:
Here we are, facing a likely start to Fed rate hikes at the Dec. 15-16, just as lumber is saying that a downturn in economic activity is coming. We know from watching the 2-year T-Note yield that the Fed should have started this process a long time ago. So now they appear to be finally getting around to doing the right thing, at the wrong time.
Valuation headwinds
So far, we have seen signs that the US economy is fragile and the Fed is about to start raising rates. Does that mean that stock prices would necessarily have to go down? In this case, downside risk may be exacerbated by a signal of high valuation from the record level of takeovers.
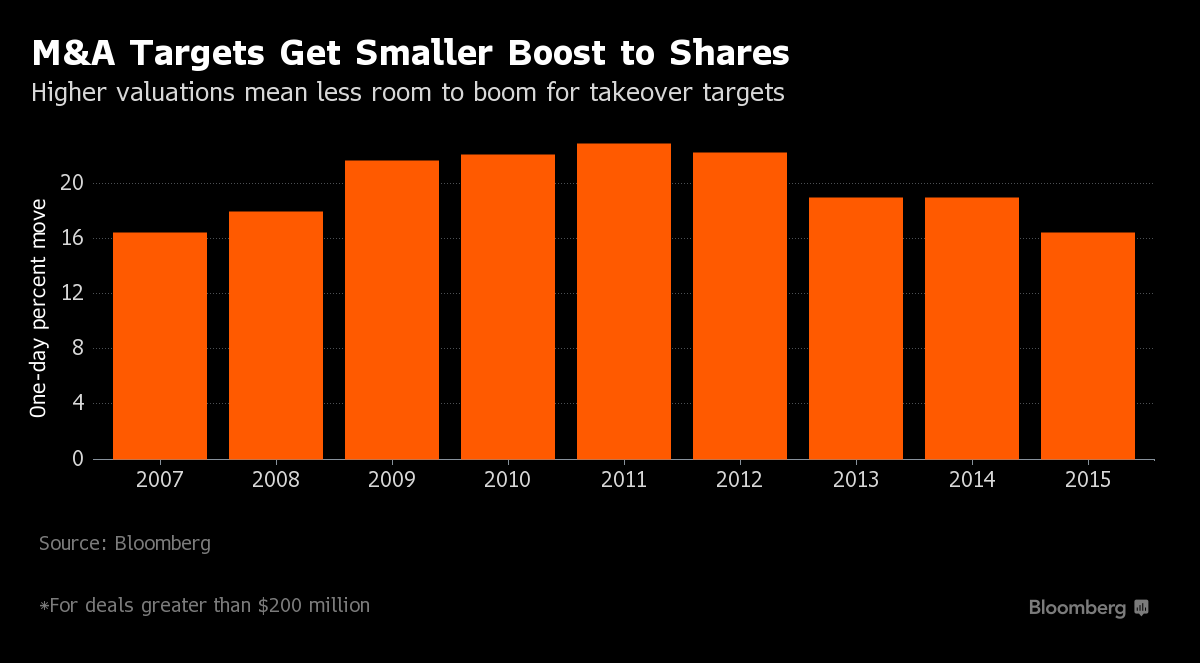
We can argue until we are blue in the face about whether stock prices are under, over or fairly valued. One of the more important clues comes from informed corporate buyers. As Bloomberg reports, takeover premiums are shrinking even as M+A activity is rising:
The biggest wave of takeovers ever to sweep the U.S. is failing to ease investors’ anxieties about rising stock valuations.
While a booming market for mergers and acquisitions is often viewed as good for equities, the impact may be diminishing. Caution can be seen in how much the stocks of takeover targets rise the day after deals are announced. In 2015, the average increase is 16 percent, the smallest gain for any year since 2007, according to data compiled by Bloomberg on deals of at least $200 million. Share price reactions are closely tied with the premium companies are willing to offer, which is also at its lowest since 2007.
Buybacks: Mining lower grade ore
One of the reasons for the lower takeover premiums could be explained by the buyback financial engineering effect, which is not relevant to a corporate buyer. Analysis from Deutsche Bank) (via Business Insider) shows that Q3 EPS growth would be flat without buybacks:
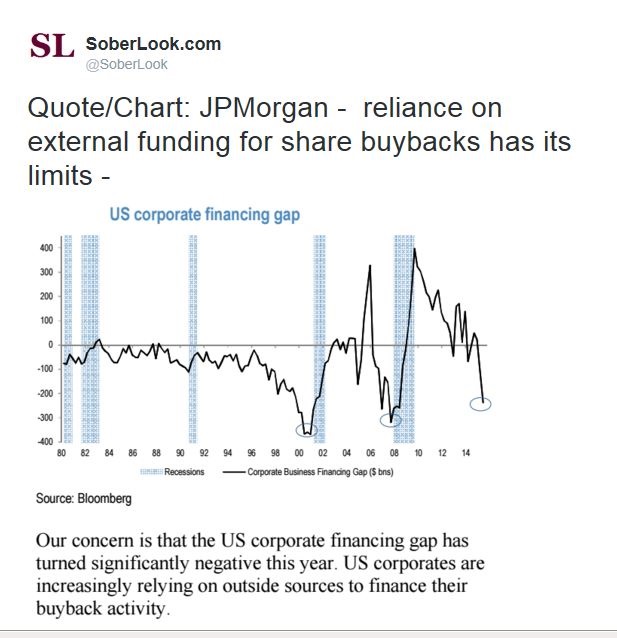
Another source of concern is that companies have been relying on external financing for buybacks. In other words, they have been borrowing to buy back their own shares (via Sober Look).
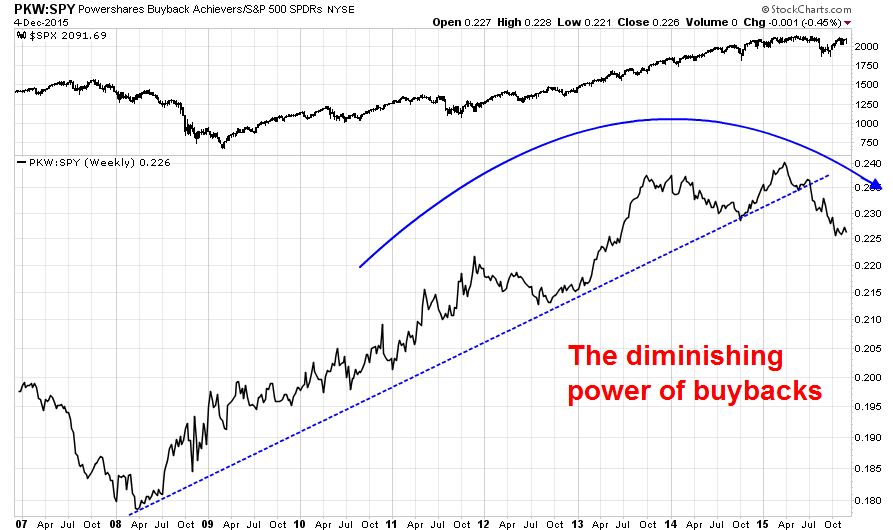
The chart below shows that as more and more companies have turned to buybacks to boost EPS and share prices, this financial engineering trick is becoming stale. The bottom panel shows the relative performance of a high buyback ETF (PowerShares Dynamic Buyback Achievers Portfolio (N:PKW)) against the market (SPDR S&P 500 (N:SPY)). The relative performance of buyback stocks have been rolling over, indicating this corporate strategy is mining lower and lower grade ore.
No need to panic…yet
What should we make of these bearish factors as we peer into 2016? Is it time to hunker down and get more defensive after the seasonal Santa Claus rally?
I have said it before and I will say it again. I love Zero Hedge in the same way that I love scanning the tabloid headlines at the supermarket checkout. ZH has built a considerable franchise in trumpeting the doomster bear case, but we need to put these bearish factors into context.
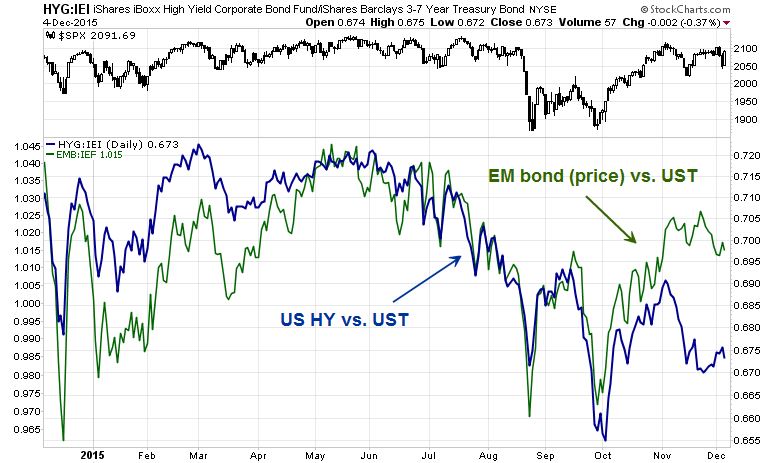
First of all, there is no question that the tanking US high yield market is worrisome. However, the chart below shows the relative price performance of US high yield (iShares iBoxx $ High Yield Corporate Bond ETF (N:HYG) vs. iShares 3-7 Year Treasury Bond Fund (N:IEI)), blue line, and Emerging Market bonds (iShares JPMorgan (N:JPM) USD Emerging Markets Bond Fund (N:EMB) vs. iShares 7-10 Year Treasury Bond (N:IEF), green line.
The fact that EM paper is performing much better than US junk is an important sign that not everything in the credit markets is falling apart.
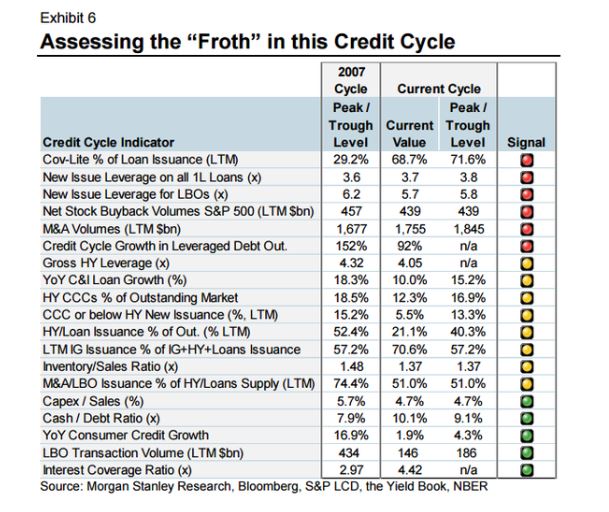
Morgan Stanley surveyed the state of the credit markets through the lens of a variety of indicators. As the chart below shows, the indicators are split roughly evenly between red (danger), yellow (caution) and green (benign). These readings suggest to me that while credit conditions are deteriorating, they are not at levels where it is time to panic and turn bearish on the stock market.
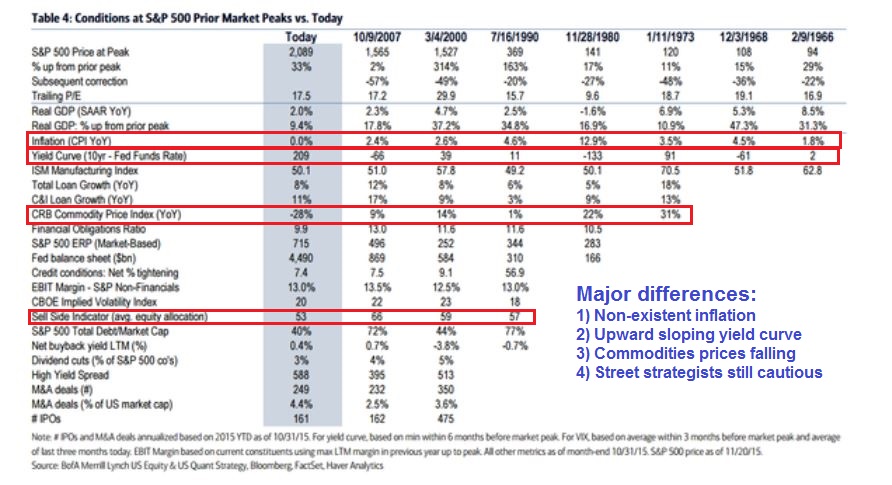
BoAML analyzed the equity markets in a similar way by comparing current conditions to previous market tops. The biggest outliers are:
- Non-existent inflation, which is a trigger for an aggressive Fed;
- An upward sloping yield curve, which is also an indication of an aggressive Fed, but could be excused because of the unusual zero interest rate policy today;
- Falling commodity prices, whereas past peaks have featured rising commodity prices, which is a sign of rising inflationary expectations (see above comment about non-existent inflation and see Chris Ciovacco’s comment about how falling commodity prices are not stock market killers); and
- The BoAML Sell-Side Indicator, which is a measure of Street strategist sentiment, remains cautious, which is contrarian bullish.
Late cycle, not bear phase
My interpretation is current economic and market environment represent a late cycle expansion, where market excesses and cracks start to appear. The negative factors cited are just some of cracks and excesses that are typical of a topping process that will likely take 6-12 months to complete. New Deal democrat recently reviewed some of the signs of deterioration in the economy and he concluded:
This also suggests that we are getting later in the cycle, but interestngly, durable goods are holding up much better than nondurable goods.
At the same time, none of these have turned negative — just less positive. There is no imminent threat of a downturn.
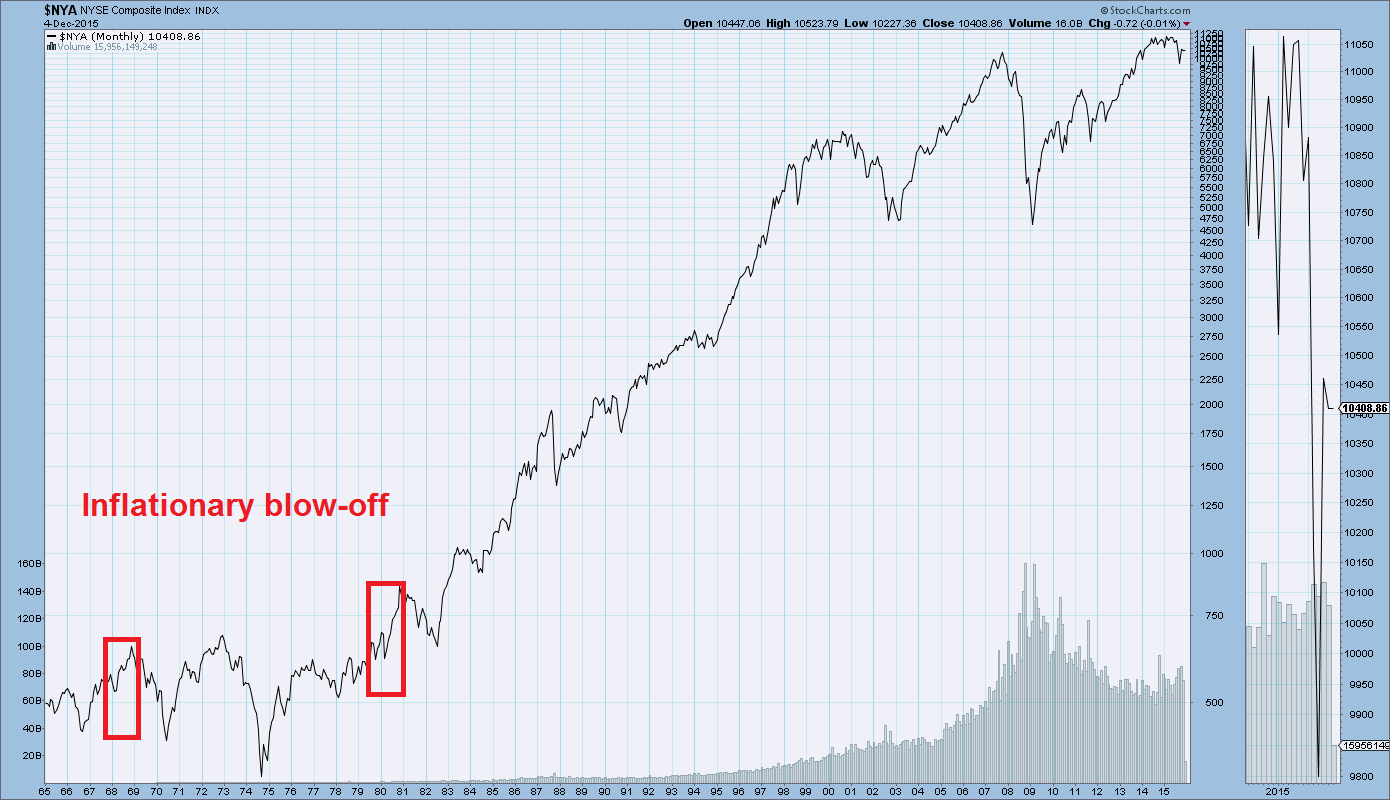
It is premature to get overly bearish right now as there is plenty of money to be made in late cycle markets, which is characterized by rising commodity prices, market excesses and a blow-off in inflationary expectations (see my previous post How to energize returns even as momentum fades). The stock markets of the 1968-1969 and 1980 can serve as approximate road maps for 2016.
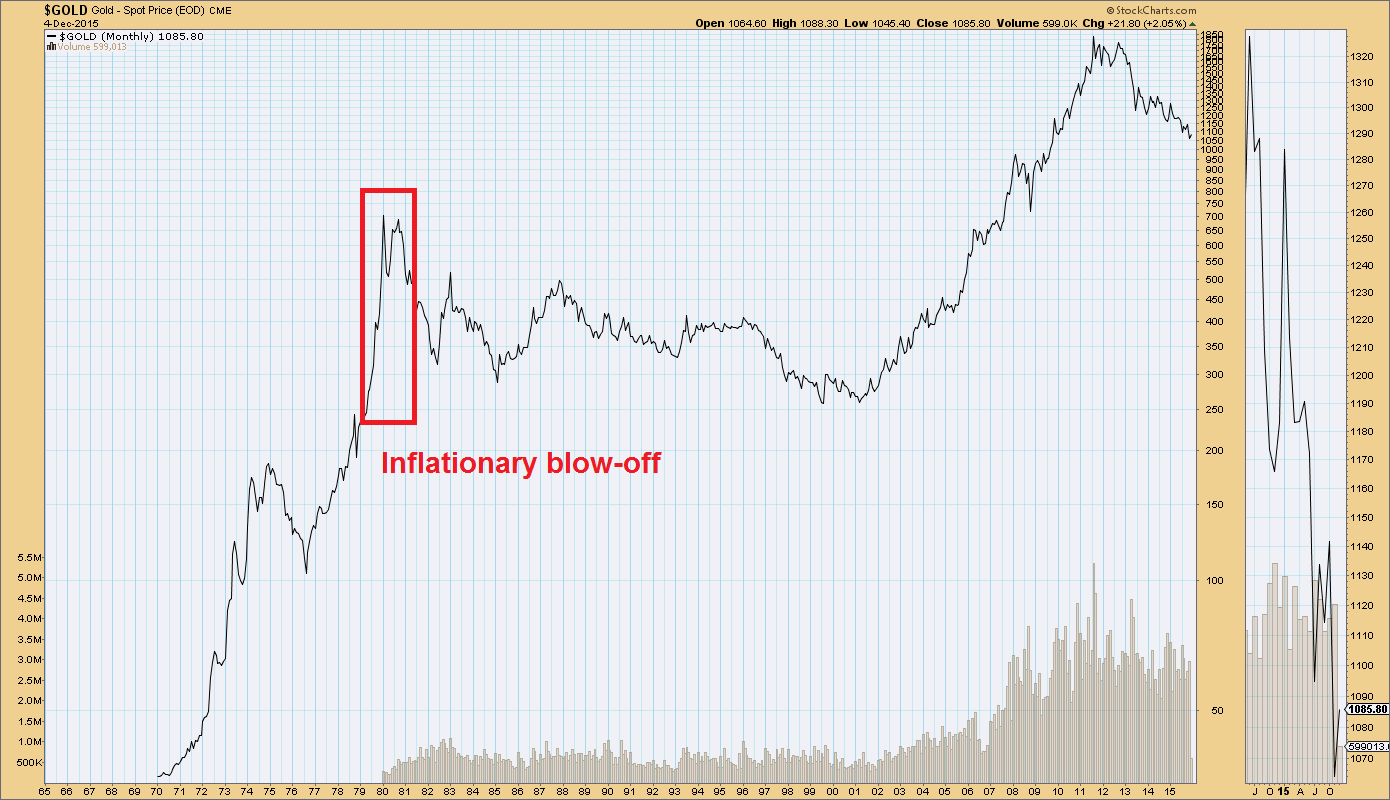
We can see an example of an inflationary blow-off market in the price of gold in 1980 when it reached its previous all-time high of $850. As history doesn’t repeat but rhymes, the 1979-1981 era was very different from today and featured runaway inflation and a Volcker Fed that stomped on the monetary brakes.
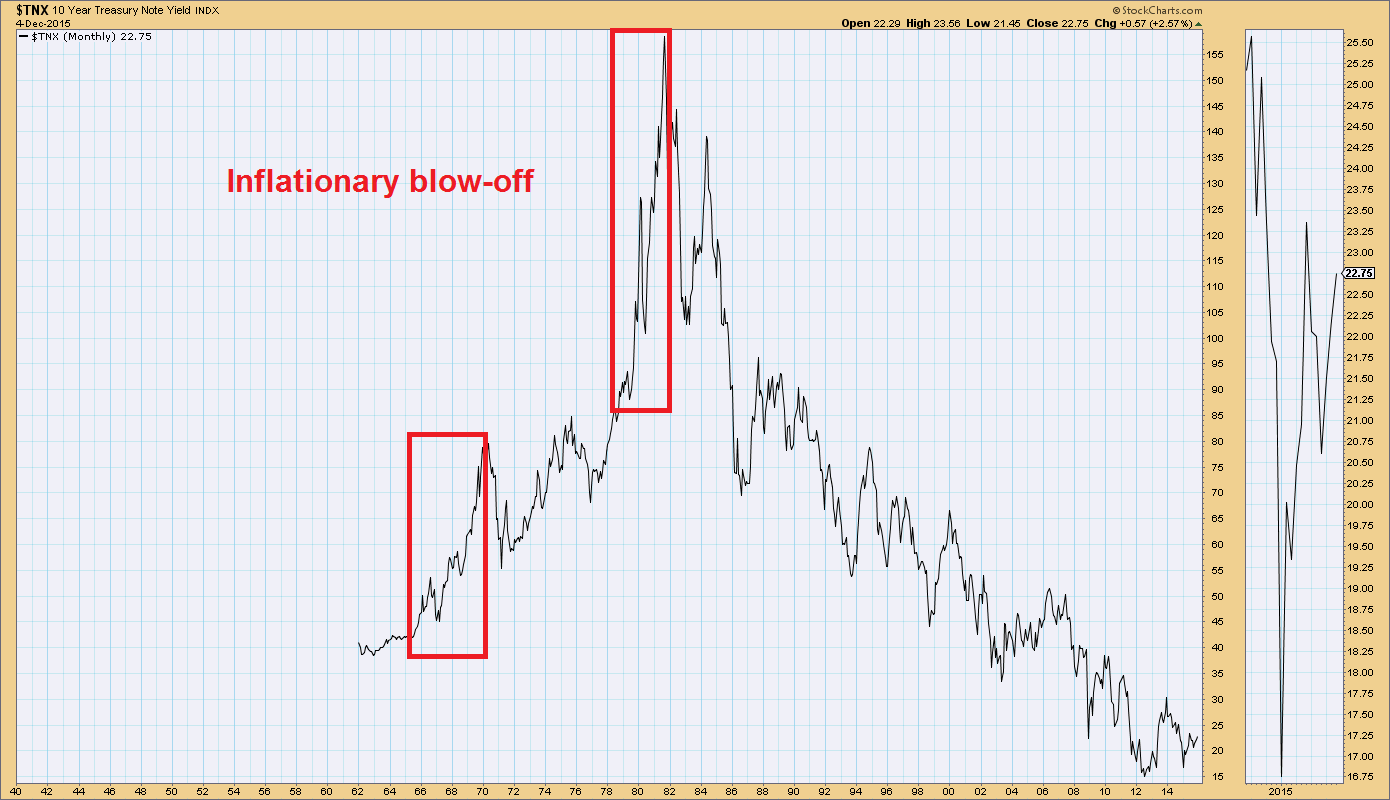
The price of gold had been fixed until 1971 and therefore we cannot gauge past inflationary expectations using gold. We can, however, go further back into history by using other indicators such as the 10-Year Treasury yield, which does respond to inflationary pressures. The chart below shows that we can see evidence of an inflationary blow-off in the 1968-1970 market, as evidenced by rising yields on the 10-year note. As well, the 1979-1981 episode also saw a spike in yields.
Here is the clincher for anyone who wants to turn bearish and go “Zero Hedge” now. This chart of the NYSE Composite shows that US stock prices saw substantial gains in 1968 and 1980 during the inflationary blow-off episode. Though I wasn’t a market participant in the late 1960s, I did learn from some of mentors who were in the market then that while gold prices were fixed in 1968, gold stocks soared in that period as inflation took off.
For the last word on this topic, I turn to Macro Man in point 7 of his Thanksgiving post:
2016 is finally shaping up as a year of divergence, macro imbalances, and, dare we hope, a return of the thinking man’s investment style.
One of the key risks of a late cycle market is overstaying its welcome as the economy keels over into recession. I am therefore keenly aware that recessions are bull market killers and signal the start of bear markets. I will be relying on a broad set of Recession Watch indicators used by New Deal democrat and Greg Vrba, neither of which are flashing warnings of an imminent recession on the horizon.
My inner investor therefore remains long equities with a tilt towards resource oriented issues. My inner trader took some profits in his long SPX positions but he is still long his energy and gold positions. He is opportunistically seeking to buy US small cap exposure in anticipation of a seasonal rally into year-end.

