This is a review of all ETF’s at year-end 2016 with a focus on liquidity, intermediate trend condition, and fundamental valuation, excluding commodity, currency and inverse ETF’s.
- Out of 1605 ETFs, 132 have 2+ years of operations, are liquid, have fundamental data, and are intermediate-term uptrends
- Among equity ETFs, 31 have price-to-cash flow rations of 10 or less
- Among country funds, Russia, Canada and Brazil stand out favorably
- Among US dividend ETFs, 4 dividend ETFs stand out favorably
- Among short-term investment grade US bond ETFs, 4 survive the filter
- Among US junk bond ETFs, 4 survive the filter
Our database has 1605 ETF’s.
Of those, our QVM 4-factor trend indicator identifies 1271 ETF’s with sufficient history (28 months) to be measured. Given the large number of choices we have today with ETF’s, it seems reasonable to require a couple of years of operating history (see explanation of the QVVM 4-factor trend indicator here).
We’d like to look at equity ETF’s, bond ETF’s or hybrid equity bond ETF’s; leaving commodity, currency and inverse ETF’s aside for this review. ETF’s which lack a price-to-book ratio or bond duration virtually eliminates commodity, currency and inverse ETF’s.
Of the 1271 ETF’s, there are 879 for which MorningStar has either a price-to-book ratio, or a bond duration. For ETF’s lacking either of those metrics, we would prefer not to review them further. If MorningStar can’t identify one of those two attributes, there would not be enough information for us to draw a reasonable fundamental conclusion, upon further research.
Of the 879, there are 753 with equity positions, because they have a price-to-book ratio. There are 145 with bond positions, because they have a bond duration attribute. There are 19 ETF’s that have both a price-to-book ratio and a bond duration suggesting they are hybrid funds.
That leaves us with a more than sufficient range of investments to consider.
After the question of some fundamental data being available, comes the question of trading liquidity. It’s very difficult to take position of “size” if the dollar volume of trading activity is low.
For large positions, such as $1 million, high trading volume is appropriate, and the list of suitable ETF’s small. For modest positions, such as $25,000, the list of suitable ETF’s is much larger.
For practical purposes, we think that an ETF should exhibit a per minute Dollar trading volume of at least $15,000 to be useful for modest positions. Therefore, we eliminated all ETF’s with 3-month average per minute trading volume less than $15,000.
Sometimes you will find an interesting sounding ETF, only to discover that it hardly trades at all. At the extreme in our filter today is Barclays Bank iPath Pure Beta Energy (NYSE:ONG) which averaged $1 (that is one Dollar) trading volume per minute over the last three months. There are 175 ETF’s within the 753 that averaged less than $1,000 per minute trading volume in the last three months. The general proposition is that you probably don’t want to be investing in something that trades only several thousand Dollars per minute.
Using the $15,000 threshold, there are 324 ETF’s of the 879 that have price-to-book ratio or a bond duration.
We then ask which of these 324 ETF’s is in an intermediate-term uptrend. Using our QVM monthly 4-factor trend indicator, we find 205 are in uptrends. However, when we eliminate those that are not hitting on all our trend indicator dimensions only 132 remain.
100 of the ETF’s with an equity component have a trailing 12 month yield of 1% or more.
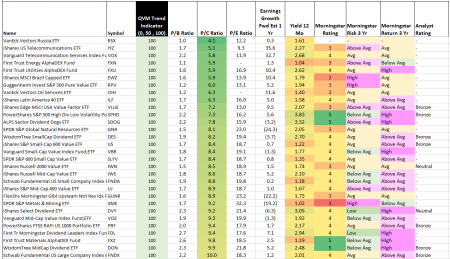
Of those 100, there are 31 with a price-to-cash flow ratio of 10 or less. Here they are ranked by price to cash flow.
To the extent that you seek a combination of positive intermediate price trend and attractive price-to-cash flow valuation, and at least some dividend income, these equity ETFs provide hunting ground.
(click images to enlarge)
Only eight bond funds survived the trend criterion filter. Here they are — you can see that they are floating-rate, short-term, or high-yield:

None of the hybrid equity/bond funds made it through the trend criterion filter.
If you are looking for country funds to diversify from a heavy US concentration, VanEck Vectors Russia (NYSE:RSX), iShares MSCI Canada (NYSE:EWC) and iShares MSCI Brazil Capped (NYSE:EWZ) are among the ETFs that survived the filter — each heavily depend on natural resource exports (not the least of which is oil). Here is how they look on a monthly basis versus the S&P 500 (SPY (NYSE:SPY)) — they outperformed the S&P 500 over the past year.
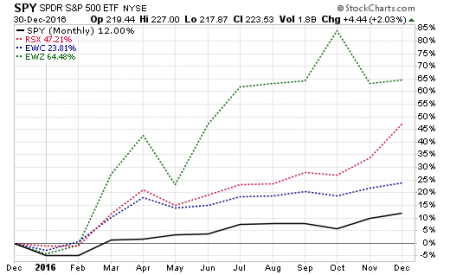
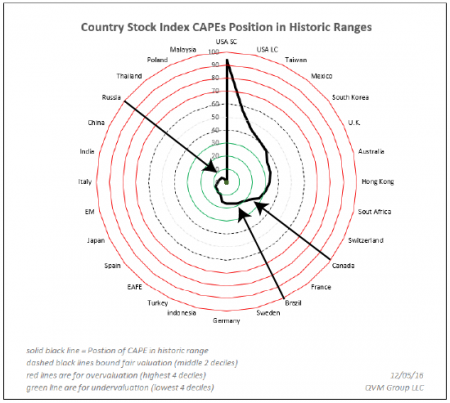
These three countries also have attractive CAPE ratios (Shiller 10-year inflation adjusted P/E ratios relative to their own long-term history) — meaning they seem to have good long-term mean reversion potential.
Here is a spider web chart showing the position of the CAPE ratio of 28 country indexes to their own long-term history. Values in the red areas have negative mean reversion potential. Those in the green areas have positive mean reversion potential. Values between the dashed black lines represent the middle quintile of positions (the likely fair value area). You will also notice that the US is very expensive relative to other countries by this measure.
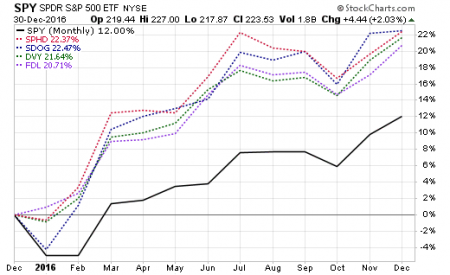
Looking toward above average dividend yield, these four ETFs made it through the filter – they outperformed the S&P 500 over the past year (SPHD, SDOG, DVY, FDL):
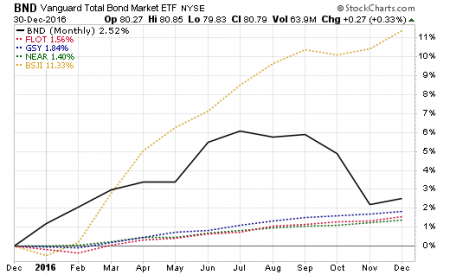
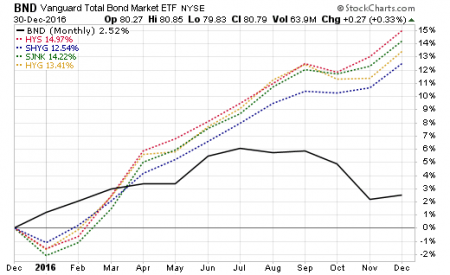
Here are comparative performance charts for the short-term investment grade bond ETFs, and for the high yield bond ETFs – first the investment grade bond funds, then the junk bond funds
The short-term investments grade bonds were steady performers (except for BSJI which zoomed for reasons we have not explored) and turned in a respectable performance for low duration versus the Aggregate Bond index (iShares Floating Rate Bond (NYSE:FLOT), Guggenheim Enhanced Short Duration (NYSE:GSY), iShares Short Maturity Bond (NYSE:NEAR), Guggenheim Invest BulletShares 2018 High Yield Corporate Bond (NYSE:BSJI)):
The junk bonds outperformed the Aggregate Bond index and were pretty steady in their performance (PIMCO 0-5 Year High Yield Corporate Bond (NYSE:HYS), iShares 0-5 Year High Yield Corporate Bond (NYSE:SHYG), SPDR Barclays Short Term High Yield Bond (NYSE:SJNK), iShares iBoxx $ High Yield Corporate Bond (NYSE:HYG)).
Overall the 39 funds in the tables above may provide some interesting ETF selections for the intermediate-term, or longer.
ETF’s highlighted in this post: RSX, EWC, EWZ, SPHD, SDOG, DVY, FDL, FLOT, GSY, BSJI, HYS, SHYG, SJUNK, HYG
