The NASDAQ Dividend Achievers Index is made up exclusively of United States stocks with 10 or more consecutive years of dividend increases.
There are currently 274 stocks in the Dividend Achievers Index.
The downloadable Dividend Achievers Spreadsheet List below contains the following for each stock in the index:
- Dividend yield
- Name and ticker
- Price-to-earnings ratio
How to Use The Dividend Achievers List
The list of all 274 Dividend Achievers is valuable because it gives you a concise list of all United States stocks with 10+ consecutive years of dividend increases.
These are businesses that:
- Want to reward shareholders with dividends
- Have the ability to pay rising dividends every year
Together, these two criteria form a powerful pair. They become even more powerful when one includes valuation in the mix.
The spreadsheet above allows you to sort by price-to-earnings ratio so you can quickly find undervalued dividend paying businesses with 10+ years of consecutive dividend increases.
Other Dividend Lists
The Dividend Achievers list is not the only way to quickly screen for businesses that regularly pay rising dividends.
The Dividend Aristocrats Index is comprised of 50 businesses with 25+ years of consecutive dividend increases. It is more exclusive than the Dividend Achievers Index.
The Dividend Kings List is even more exclusive. It is comprised of under 20 businesses with 50+ years of consecutive dividend increases.
Performance of the Dividend Achievers Index
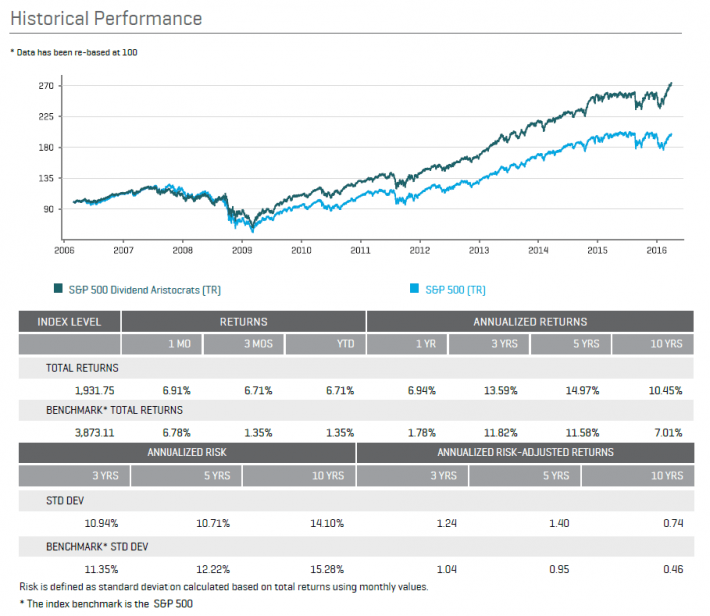
The Dividend Aristocrats List has realized outstanding performance over the last decade.

Source: S&P 500 Dividend Aristocrats Factsheet
Stocks with 25+ consecutive years of dividend increases have soundly outperformed the market over the last decade.
It stands to reason that the Dividend Achievers Index would also outperform.
But there are critical differences…
The Dividend Aristocrats index is equally weighted. The Dividend Achievers index is market cap weighted.
This means that larger stocks with higher market caps make up a greater portion of the Dividend Achievers index. The problem with market cap weighting is that it is the opposite of value investing.
Imagine that a stocks’ price-to-earnings ratio rises from 10 to 20 while earnings do not change. The company’s market cap would double. In the real world, paying twice as much for the same thing is not a ‘good deal’. With market cap weighting, the Dividend Achievers index would hold double its investment in the business that saw its P/E ratio double.
And it gets worse from there…
The Dividend Achievers index does not increase ownership in businesses that have seen their market caps decline. This means that if a different business saw its price-to-earnings ratio decline from 30 to 15 (and earnings were unchanged), the Dividend Achievers Index would see its ownership of this business fall by 50%.
Market cap weighting does not take advantage of valuation, while equal weighting does.
With equal weighting, if a company’s price-to-earnings ratio falls by 50%, the fund will have to buy more to keep weights equal. Similarly, an equal weighted fund well have to sell when the price-to-earnings ratio of a business rises to keep the fund equally weighted.
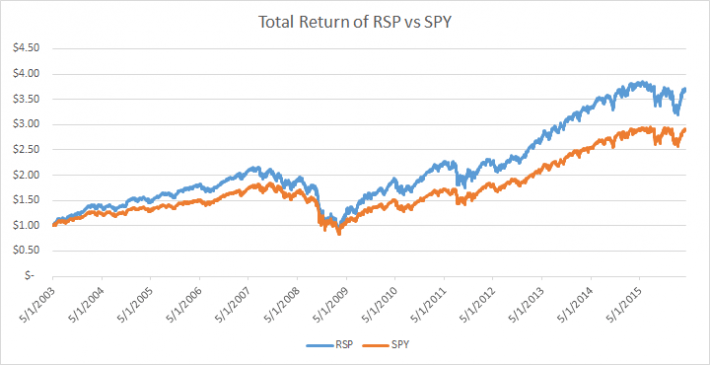
The image below shows how the performance of the equal weighted S&P 500 ETF (NYSE:RSP) versus the market cap weighted S&P 500 ETF (SPY (NYSE:SPY)). Note that RSP outperforms even though its expense ratio is 0.40% versus 0.09% for SPY.

Another difference between the Dividend Aristocrats and the Dividend Achievers is dividend history. 10 years is a sizeable streak of consecutive dividend payments. It covers (at best) 1 economic cycle.
25 years of consecutive dividend increases covers multiple economic cycles. Dividend Achievers do not have the same level of consistency as Dividend Aristocrats. Dividend history matters.
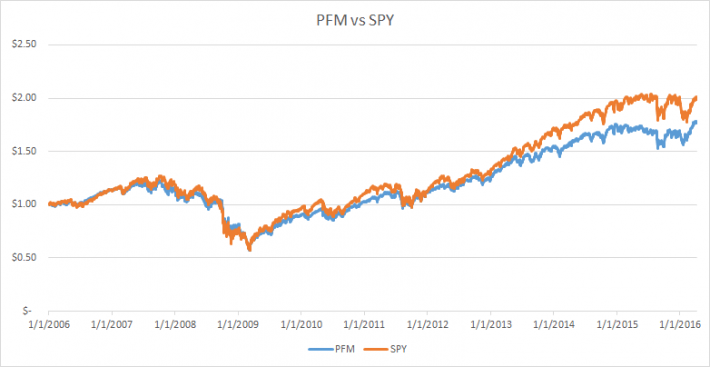
The performance of the Dividend Achievers ETF (NYSE:PFM) versus the S&P 500 ETF (SPY) is shown below:

Another disadvantage PFM has is its higher expense ratio. PFM has an expense ratio of 0.50% versus 0.09% for SPY.
Thoughts on Underperformance
SPY and PFM are both market cap weighted. PFM has a higher expense ratio, but before running historical performance numbers I would have expected PFM to outperform SPY.
Dividend stocks have historically outperformed non dividend paying stocks. Stocks with long dividend histories (Dividend Aristocrats) have historically outperformed the market. Why haven’t the Dividend Achievers outperformed?
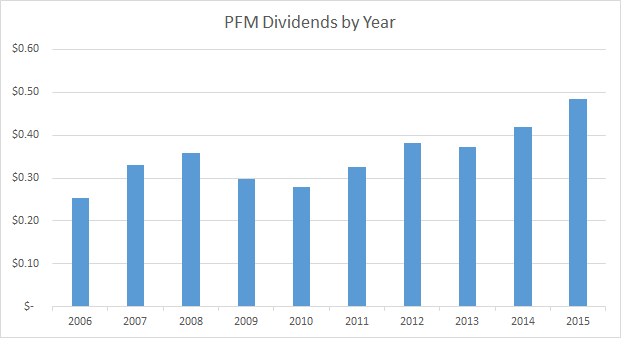
The Dividend Achievers index has compounded its dividend payments at 7.5% a year over the last decade. This is reasonably good growth.

With 10 year average dividend growth of 7.5% a year and a current 2.4% dividend yield PFM should compound investor wealth at just under 10% a year going forward. PFM currently has a price-to-earnings ratio of 18.6, versus 22.6 for the S&P 500.
The funds historical underperformance is likely due to many of its securities being overvalued. I do not have access to the funds 2005 or 2006 prospectus, but it would be very interesting to see the average price-to-earnings ratio and dividend yield of the fund at that time.
Regardless, there are better dividend ETFs for fund investors to choose from.
The Dividend Achievers list is best used as a starting point for finding high quality dividend growth stocks.
