Most of us hardly ever think about the processes involved in bringing even the simplest consumer goods to the market. The production of many products we buy requires manufacturers to access a range of basic materials.
Here we'll take a deeper look at this critical sector and two exchange-traded funds (ETFs) worth considering:
Cyclical Sector
Companies in the basic materials sector are typically involved in discovering, developing and processing raw materials—naturally occurring resources. Sub-sectors include industrial metals, mining, petrochemicals, forestry, agriculture and construction materials.
Market supply and demand conditions influence the basic materials. For example, the strength of the housing market affects the demand for lumber. Similarly, limestone is one of the primary raw materials required for cement production.
Cement, construction sand and gravel are all essential ingredients of concrete. steel, cement, and aluminum are used in the construction of buildings and infrastructure as well as in the manufacturing of industrial products.
Thus materials stocks are typically cyclical, becoming more valuable in a healthy economy. In the U.S., the Dow Jones Basic Materials index tracks the performance of basic materials companies.

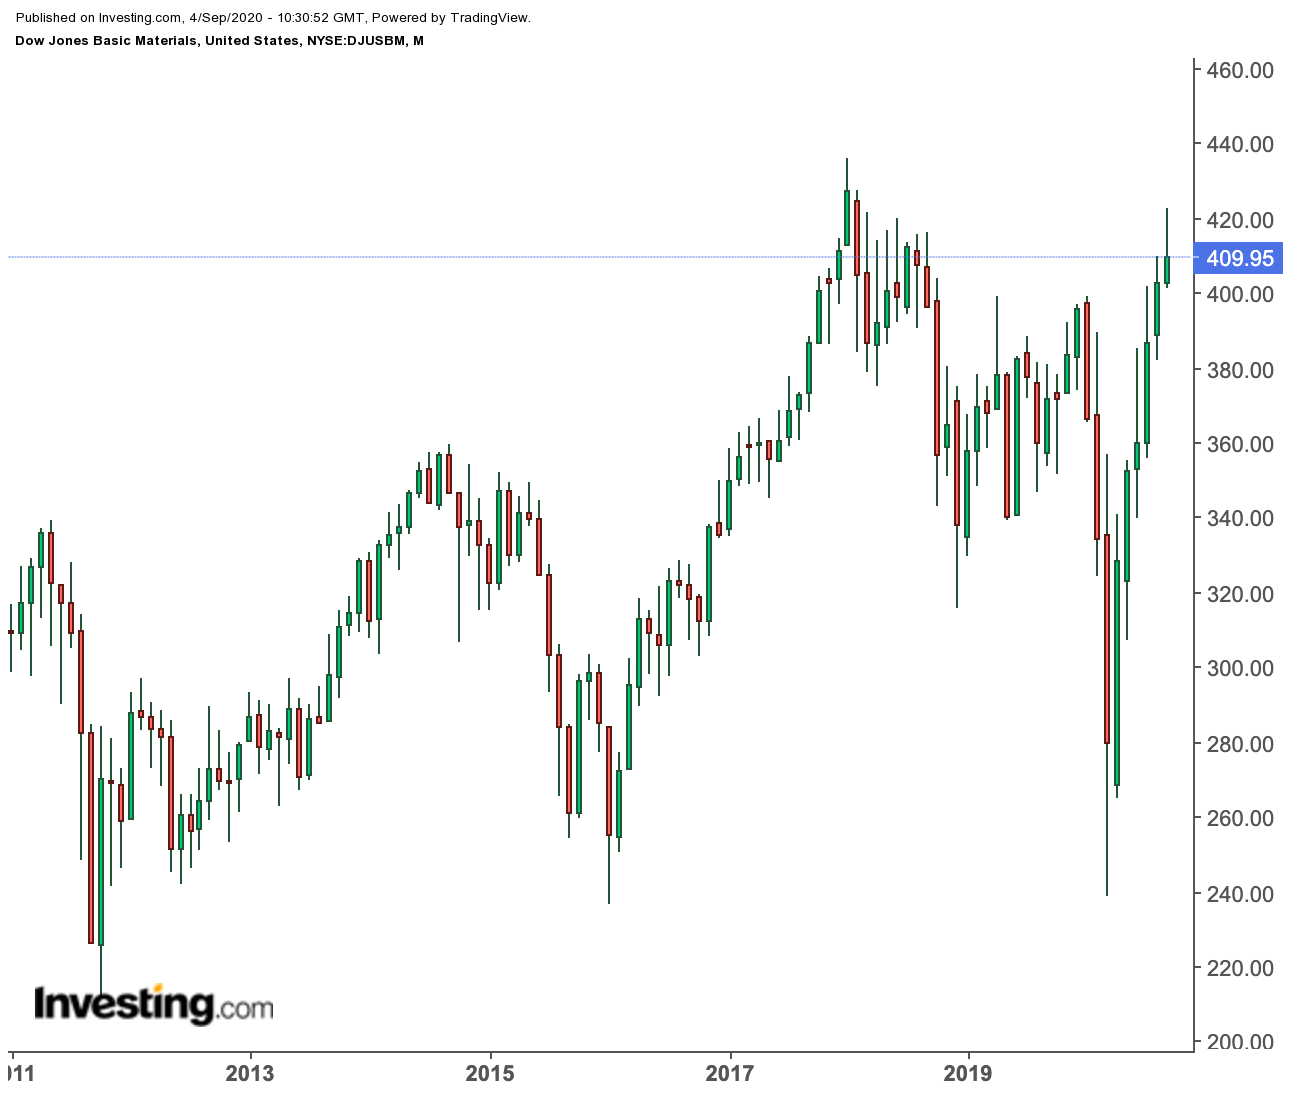
The decade-long chart above gives a better indication of the cyclical nature of the sector. Investors may note that in 2018 and 2019, escalating trade tensions between the US and China negatively affected the index. As a result, the materials sector has underperformed the broader market. The Dow Jones Basic Materials index has bounced back from its March lows to make a recent 52-week high.
Most ETFs concentrate on commodity-based industries such as chemicals, energy, minerals, forest products and miners of precious metals. With that said, here are two funds that may pique investors' interest.
1.Vanguard Materials ETF
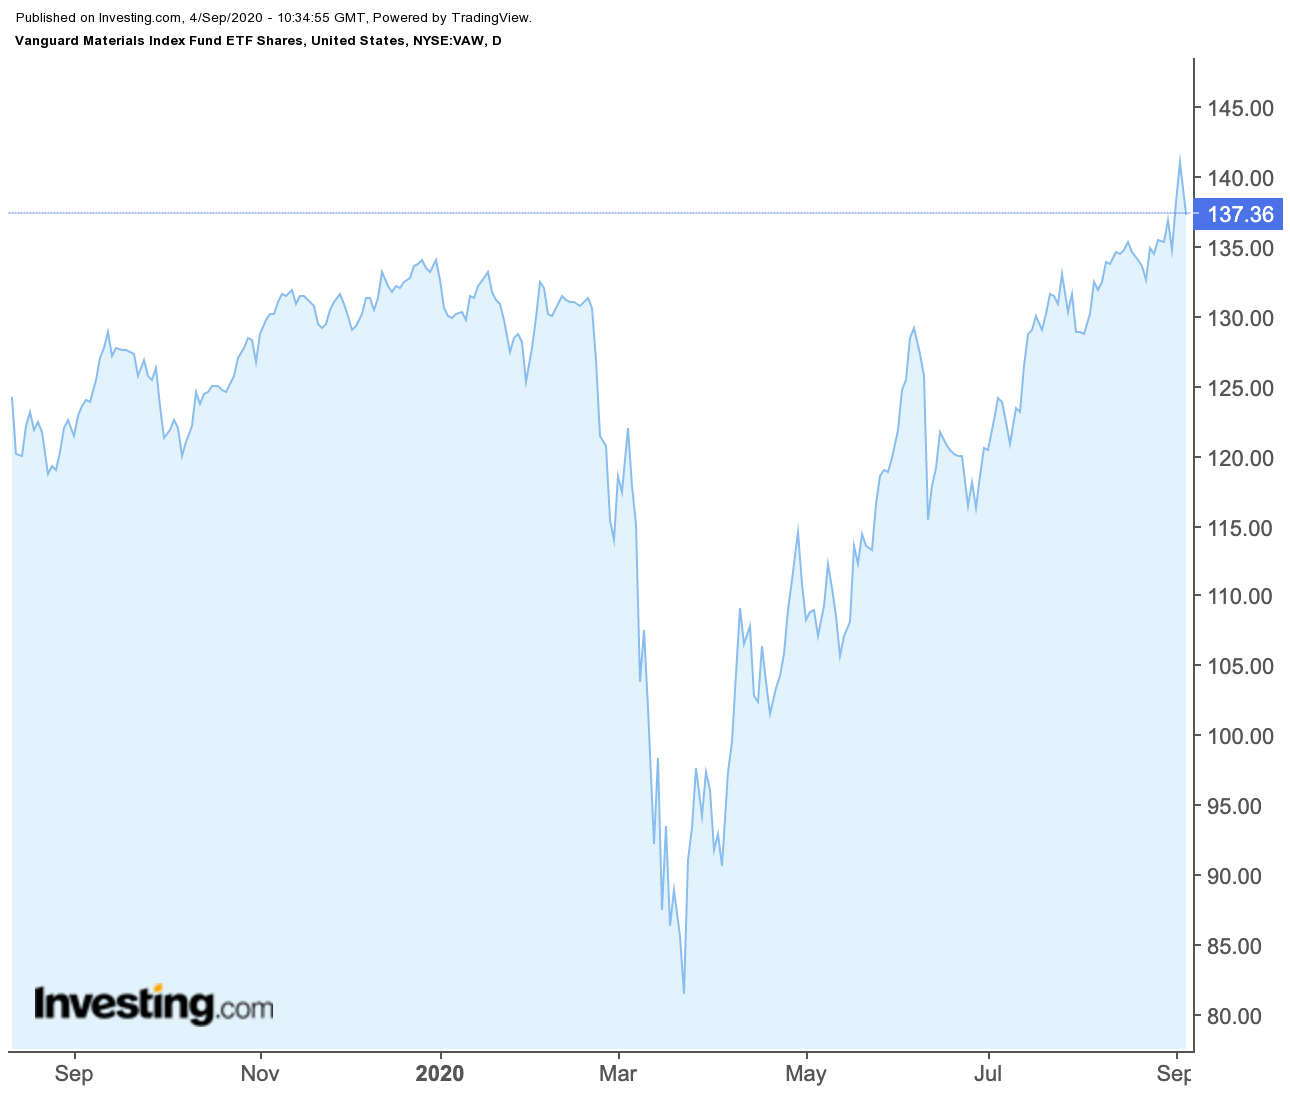
- Current Price: $137.36
- 52-Week Range: 81.1 - 141.35
- Dividend Yield (TTM - Trailing Twelve Month) : 1.8%
- Expense Ratio: 0.10% per year, or $10 on a $10,000 investment
The Vanguard Materials ETF (NYSE:VAW) provides exposure to the materials sector and includes shares of companies that extract or process raw materials. VAW is possibly one of the cheapest and most comprehensive US materials-sector ETFs available.

VAW, which includes 116 stocks, tracks the Spliced US IMI Materials 25/50 index. The most important sectors (by weighting) are Specialty Chemicals (28.5%), Industrial Gases (22.2%), Paper Packaging (7.8%), Gold (7.7%), and Commodity Chemicals (6.9%). These five sectors comprise close to three-fourths of the fund.
The top ten holdings make up about 55% of total net assets, which stand at $2.1 billion. VAW's top five companies are Linde (NYSE:LIN), Air Products and Chemicals (NYSE:APD), Newmont Goldcorp (NYSE:NEM), Sherwin-Williams (NYSE:SHW) and Ecolab (NYSE:ECL).
Year-to-date, the fund is up over 5%. However, since the lows seen in March, VAW has soared over 70%. The 52-week high of $141.35 came on Sept. 2. As we enter the final stretch of 2020, investing in VAW now would require taking a positive view of the health of the US economy.
The fund saw its all-time high in January 2018 when it hit $144.65. We believe there may soon be an attempt to take out that level. One catalyst for the continued up move could be the US Presidential election. If either candidate promises greater spending on infrastructure programs, then shares of a range of companies in the sector could get a boost. However, following a potential new high, short-term profit-taking would be in the cards.
2. iShares Global Materials ETF
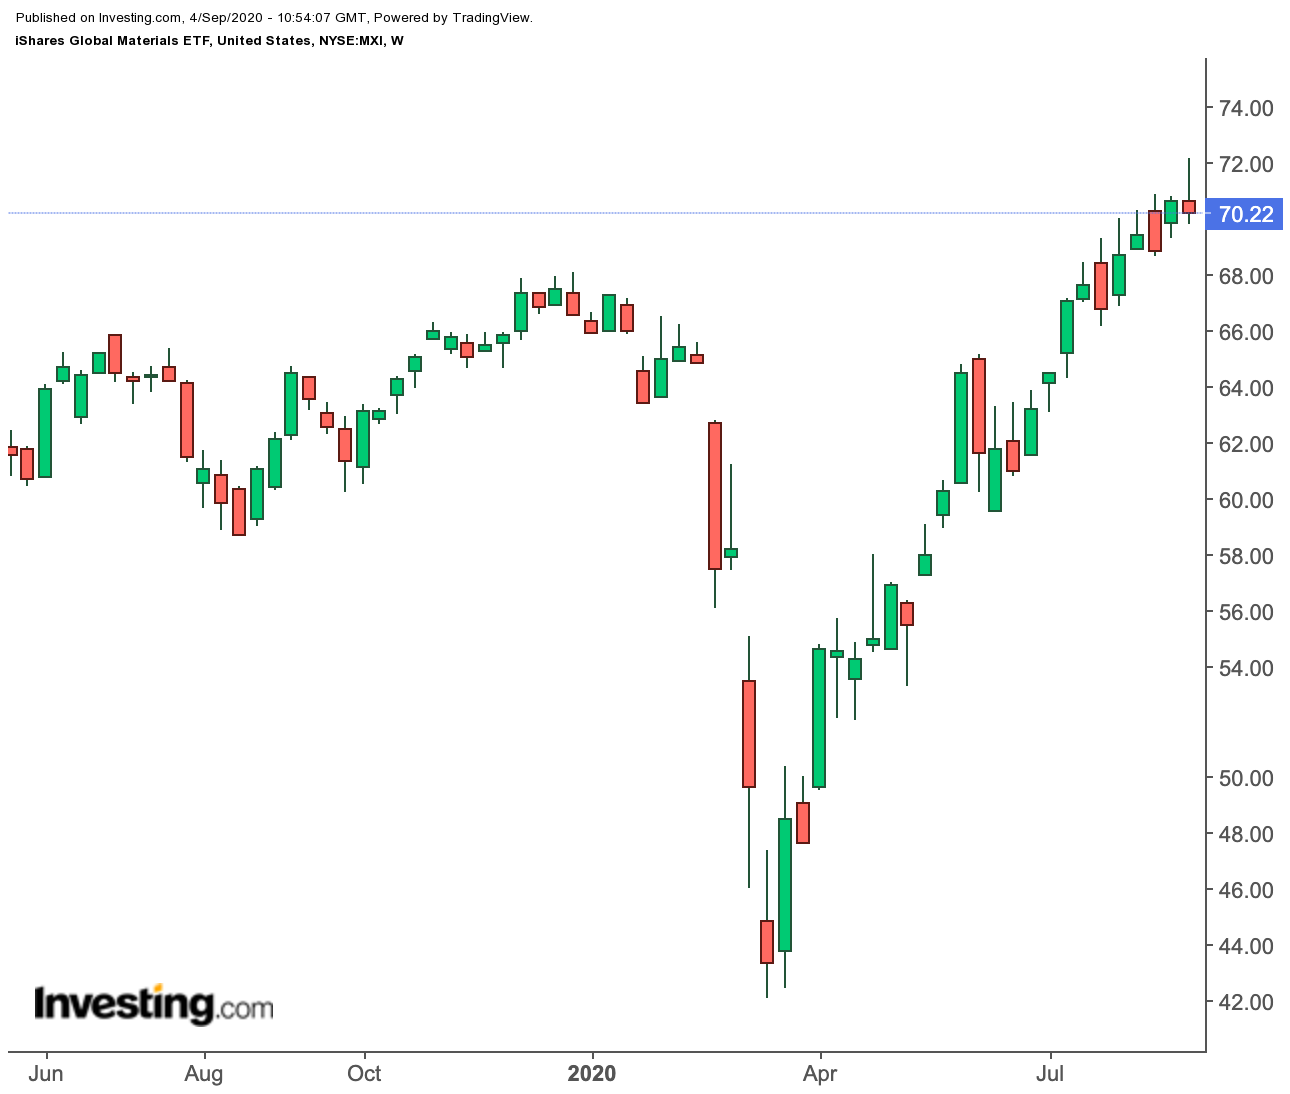
- Current Price: $70.22
- 52-Week Range: $42.09 - $72.15
- Dividend Yield (TTM - Trailing Twelve Month) : 3.96%
- Expense Ratio: 0.45% per year, or $45 on a $10,000 investment
The iShares Global Materials ETF (NYSE:MXI) provides exposure to global companies involved with the production of raw materials, including metals, chemicals and forestry products.

MXI, which has 104 holdings, tracks the S&P Global 1200 Materials Sector index. The most important sectors (by weighting) are Chemicals (52.60%), Metals & Mining (33.46%) and Containers & Packaging (5.63%) and these three sectors comprise over 90% of the fund.
The top ten holdings make up about 40% of total net assets which stand at $400 million. MXI's top five companies are Linde, BHP Group (NYSE:BHP), L'Air Liquide Societe Anonyme pour l'Etude et l'Exploitation des Procedes George (OTC:AIQUY), Air Products and Chemicals and Rio Tinto (NYSE:RIO).
Year-to-date, the fund is up about 7%. Like VAW, since early spring, it has surged by over 75%. In fact, it hit a 52-week high on Sept. 2. An attempt at $75.19, last seen in January 2018, is possible.
