🐂 Not all bull runs are created equal. November’s AI picks include 5 stocks up +20% eachUnlock Stocks

10 Year Treasury Note And SPX Overlay

Published 06/11/2017, 12:08 PM
Updated 03/09/2019, 08:30 AM
US500
-
US10YT=X
-

Many traders around the World keep picking the top in Indices and fail to capitalise on the trend which is to the upside. Recently, we did an article to explain World Indices could see another huge peak around 2020 – 2022, of course there would be corrections in between but they should offer nothing more than a buying opportunity in the sequence of 3, 7 or 11 swings.

Advantage of trading with technique is that even when the trend is extreme, you are trading with a defined risk and get a chance to eliminate risk on the trade as the market bounces from extreme areas after 3 swings, 7 swings or 11 swings. In this video we explain the relationship between ZN (10 Year Treasury Note) and SPX.

ZN (10 Year Treasure Note) and SPX Overlay
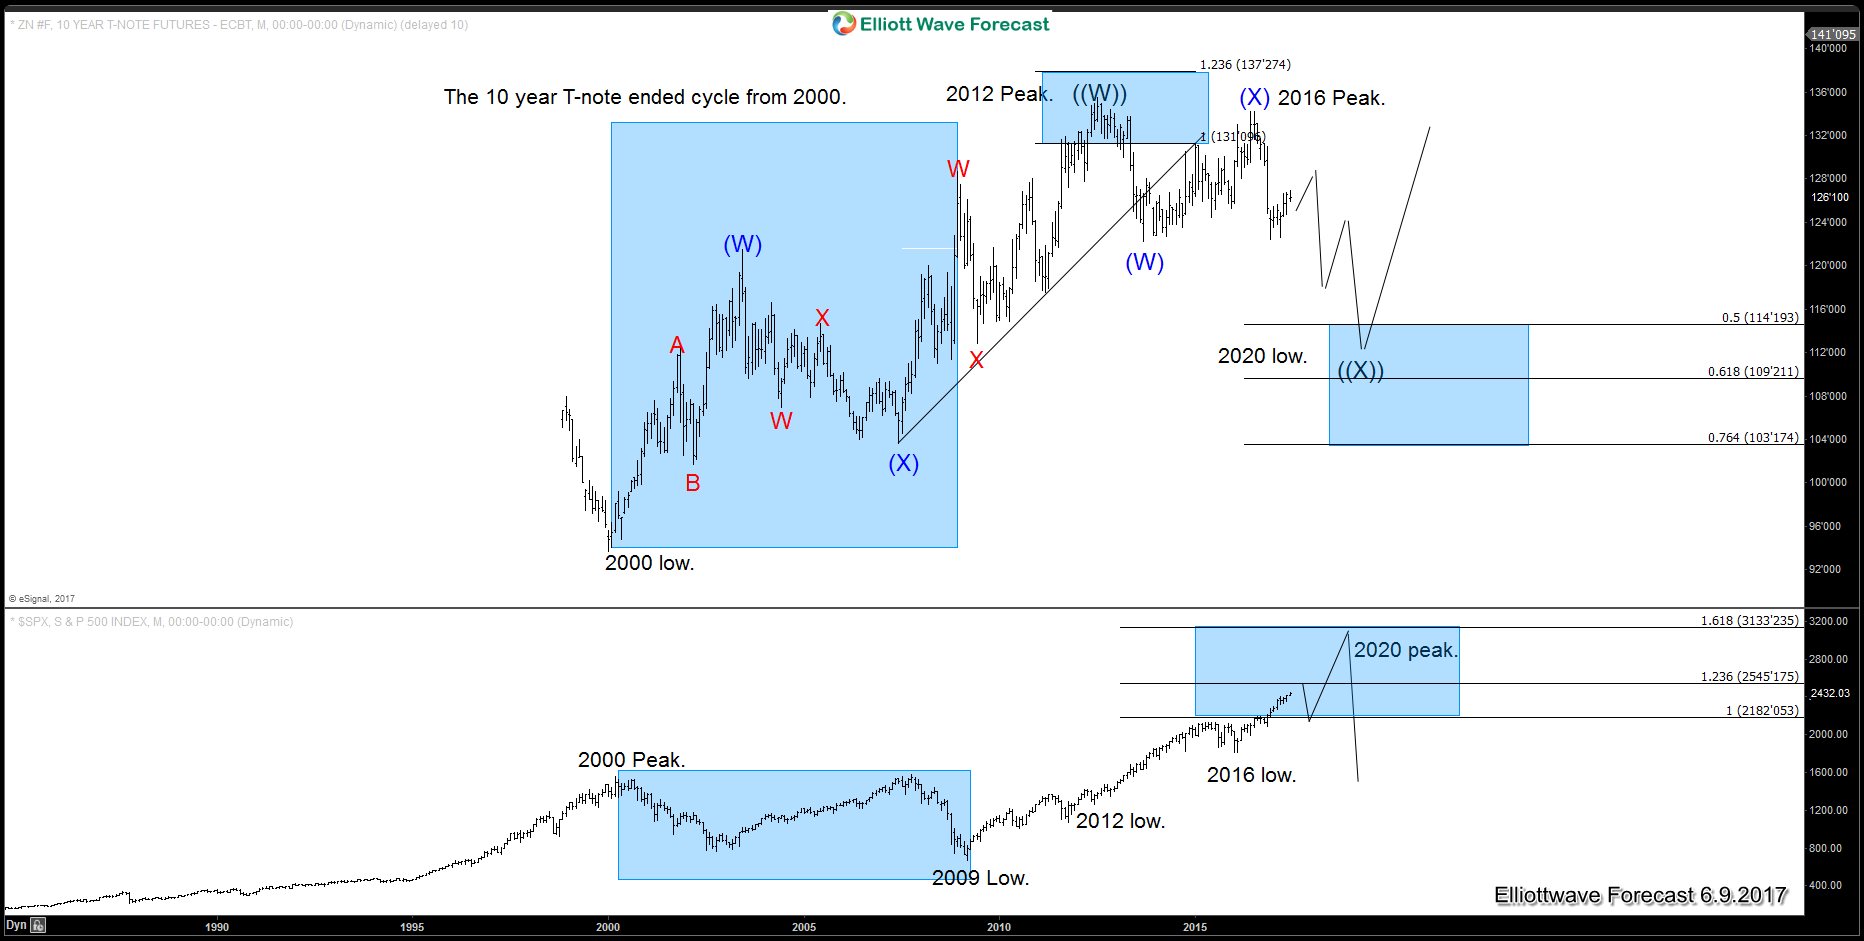
ZN, SPX Overlay Monthly Chart

Above chart shows ZN (10 Year Treasury Note) has ended the cycle from 2007 low and most likely from 2000 low as well and as far as bounces fail below 2016 and more importantly below 2012 peak, 10 year note prices can drop towards 117 – 114.19 area to finish correcting 2000 cycle and then turn higher again for another monthly cycle or make a larger 3 waves bounce at least. We can see in the above chart that 10 year note formed a peak in 2012 and dropped and SPX rallied.

Then we saw another secondary peak in 10 year note in 2016 which was a low in SPX and caused another rally. While below 2016 peak, 10 year note prices should drop further and that should cause SPX rally to extend and it could reach as high as 3133 area by the year 2020 – 22. Therefore, we don’t like picking the tops in Indices and expect buyers to appear in the dips after 3, 7 or 11 swings. When 10 year note prices reach 117 – 114.19 area, Indices would have a chance to form a huge peak and start a larger pull back and that should be a good time to buy 10 year T-note.

Latest comments

Loading next article…
Risk Disclosure: Trading in financial instruments and/or cryptocurrencies involves high risks including the risk of losing some, or all, of your investment amount, and may not be suitable for all investors. Prices of cryptocurrencies are extremely volatile and may be affected by external factors such as financial, regulatory or political events. Trading on margin increases the financial risks.
Before deciding to trade in financial instrument or cryptocurrencies you should be fully informed of the risks and costs associated with trading the financial markets, carefully consider your investment objectives, level of experience, and risk appetite, and seek professional advice where needed.
Fusion Media would like to remind you that the data contained in this website is not necessarily real-time nor accurate. The data and prices on the website are not necessarily provided by any market or exchange, but may be provided by market makers, and so prices may not be accurate and may differ from the actual price at any given market, meaning prices are indicative and not appropriate for trading purposes. Fusion Media and any provider of the data contained in this website will not accept liability for any loss or damage as a result of your trading, or your reliance on the information contained within this website.
It is prohibited to use, store, reproduce, display, modify, transmit or distribute the data contained in this website without the explicit prior written permission of Fusion Media and/or the data provider. All intellectual property rights are reserved by the providers and/or the exchange providing the data contained in this website.
Fusion Media may be compensated by the advertisers that appear on the website, based on your interaction with the advertisements or advertisers.
© 2007-2024 - Fusion Media Limited. All Rights Reserved.