NVDA Q3 Earnings Alert: Why our AI stock picker is still holding Nvidia stockRead More

1 More Hurdle For Nasdaq 100

Published 01/06/2017, 02:30 PM
Updated 05/14/2017, 06:45 AM
NDX
-
QQQ
-

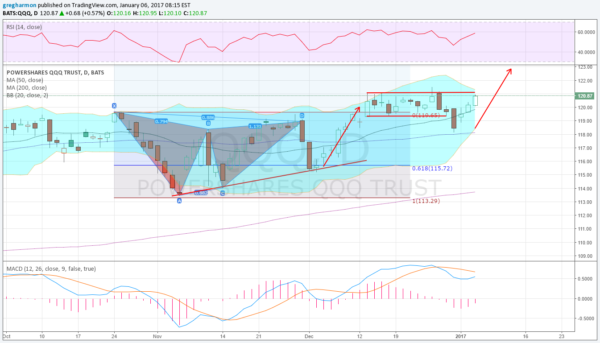
The chart below shows the price action in the Nasdaq 100 ETF QQQ since the end of October. That's when it went through a bearish harmonic Bat pattern. It was the one index that did not rocket higher following the election. The price retraced 61.8% of the Bat before reversing higher to a new all-time high December 13. And it has consolidated from there. It has made three higher highs, by pennies, but has clearly shown resistance at about 121.10 for a month.
PowerShares QQQ Trust Series 1

What could be the key to a prolonged run higher is the 3-day pullback into the end of the year. This came back to the 50-day SMA, reset the RSI and MACD lower in the bullish ranges and started a squeeze in the Bollinger Bands®. Since the calendar turned to 2017, the price has moved higher and will start Friday just below that 121.10 with momentum surging. A push through would give a target to about 123 on a Measured Move, not a major move but a good break out to start.

Latest comments

Loading next article…
Risk Disclosure: Trading in financial instruments and/or cryptocurrencies involves high risks including the risk of losing some, or all, of your investment amount, and may not be suitable for all investors. Prices of cryptocurrencies are extremely volatile and may be affected by external factors such as financial, regulatory or political events. Trading on margin increases the financial risks.
Before deciding to trade in financial instrument or cryptocurrencies you should be fully informed of the risks and costs associated with trading the financial markets, carefully consider your investment objectives, level of experience, and risk appetite, and seek professional advice where needed.
Fusion Media would like to remind you that the data contained in this website is not necessarily real-time nor accurate. The data and prices on the website are not necessarily provided by any market or exchange, but may be provided by market makers, and so prices may not be accurate and may differ from the actual price at any given market, meaning prices are indicative and not appropriate for trading purposes. Fusion Media and any provider of the data contained in this website will not accept liability for any loss or damage as a result of your trading, or your reliance on the information contained within this website.
It is prohibited to use, store, reproduce, display, modify, transmit or distribute the data contained in this website without the explicit prior written permission of Fusion Media and/or the data provider. All intellectual property rights are reserved by the providers and/or the exchange providing the data contained in this website.
Fusion Media may be compensated by the advertisers that appear on the website, based on your interaction with the advertisements or advertisers.
© 2007-2024 - Fusion Media Limited. All Rights Reserved.